SOC Graph AI — Detection, Correlation & SOAR
This project was built during my cybersecurity internship at NearSecure in Rabat. The objective was not simply to install a SIEM or collect screenshots. I designed a complete laboratory SOC workflow in which controlled adversary activity becomes a Wazuh alert, then structured evidence, MITRE context, a risk score, a graph relationship, an analyst-facing view and finally a controlled SOAR incident.
1. Problem I was solving
A SOC rarely struggles because it has no alerts. The harder problem is turning many heterogeneous alerts into something an analyst can understand and prioritize. A single event needs context: which host produced it, which user or process was involved, which rule matched, which MITRE technique it maps to, whether related events exist, and what response should follow.
The project therefore focused on six capabilities:
- Collect telemetry from several sources instead of validating on one host.
- Detect controlled behaviors using Wazuh and custom rules.
- Normalize and enrich alerts with stable fields, MITRE context and risk information.
- Correlate entities in Neo4j rather than reading alerts only as flat rows.
- Prioritize with graph metrics and local UEBA/ML signals.
- Orchestrate triage and notification without silently executing destructive response actions.
2. Architecture and component roles
The laboratory used a stable host-only 192.168.56.0/24 topology. Wazuh ran on the SOC server; Windows and Linux supplied endpoint telemetry; Kali/Caldera generated controlled adversary activity; pfSense supplied firewall logs; and the host workstation ran the Python analytics pipeline, Neo4j, Streamlit, n8n and Shuffle.
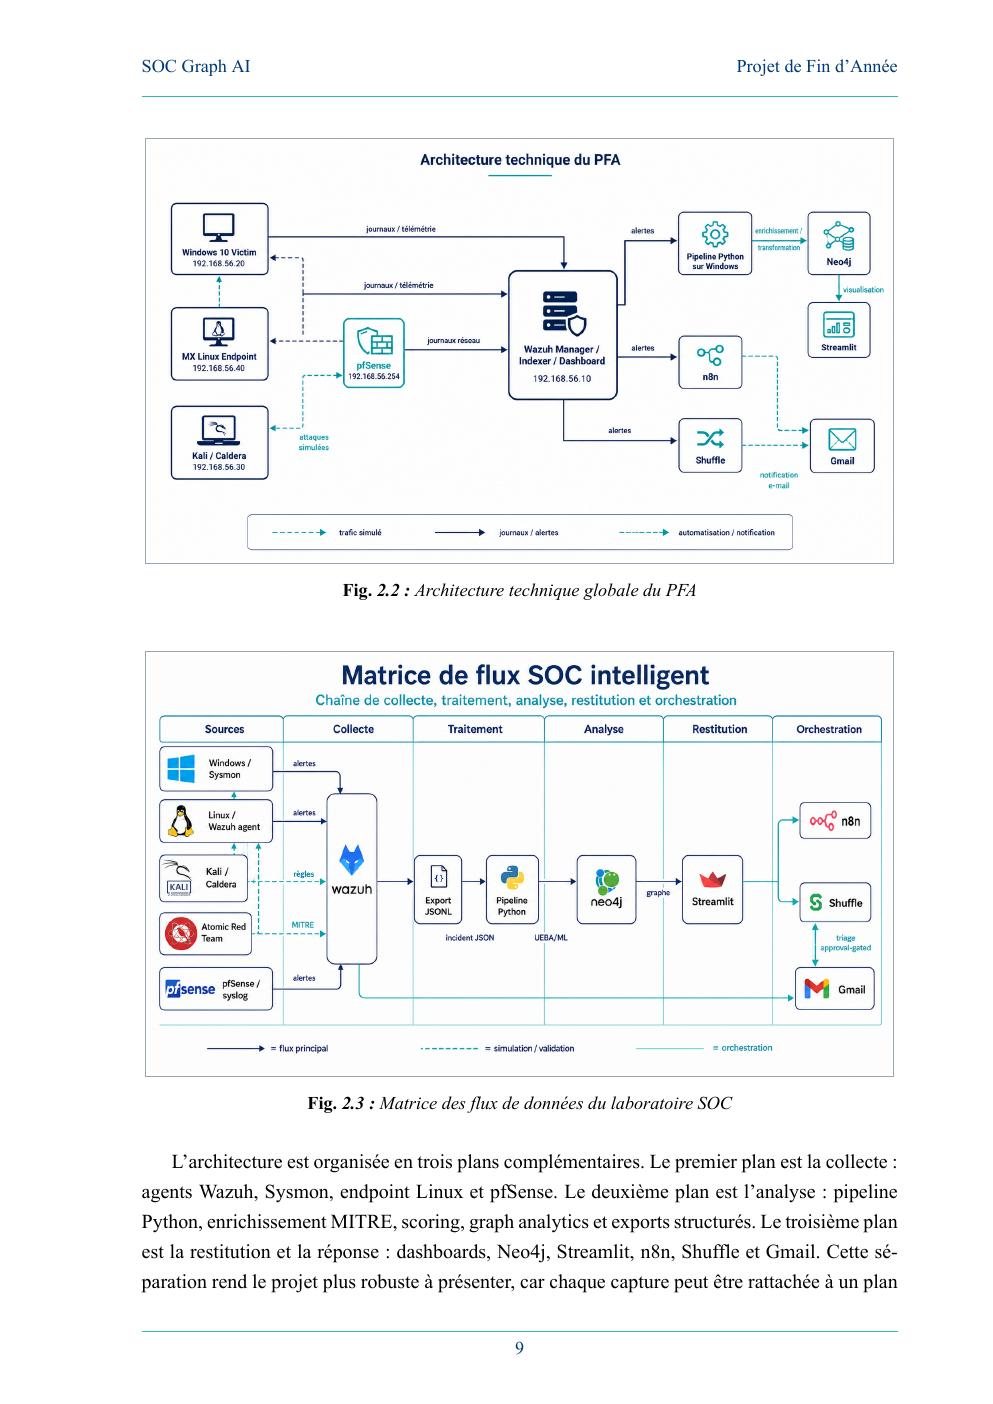
Collection plane
- Wazuh Manager / Indexer / Dashboard centralizes detection and indexed alerts.
- Windows + Sysmon provides process, PowerShell, network and file telemetry.
- Linux Wazuh agent adds Unix authentication, discovery and command signals.
- pfSense syslog contributes firewall context and blocked/rejected traffic.
- Kali + Caldera provides the controlled offensive side of the lab.
Analysis plane
normalize_wazuh_alerts.pyconverts raw JSONL alerts into stable fields.enrich_alerts.pyadds MITRE mapping, scenario context and risk information.build_graph.pycreates graph nodes and relationships.load_neo4j.pyloads those outputs into Neo4j.- UEBA/ML modules calculate anomaly scores and a local supervised validation.
Restitution and response plane
- Neo4j exposes investigation relationships.
- Streamlit turns the outputs into analyst-oriented review pages.
- n8n orchestrates export, pipeline execution, graph loading and routing.
- Shuffle provides incident parsing, triage and analyst decision flow.
- Gmail is used as a final notification channel.
3. Building trustworthy telemetry first
Before testing attacks, I validated the basic infrastructure: stable virtual machines, fixed IP addresses, connectivity, Wazuh services and active agents. This matters because every later graph relationship or dashboard metric depends on trustworthy collection.
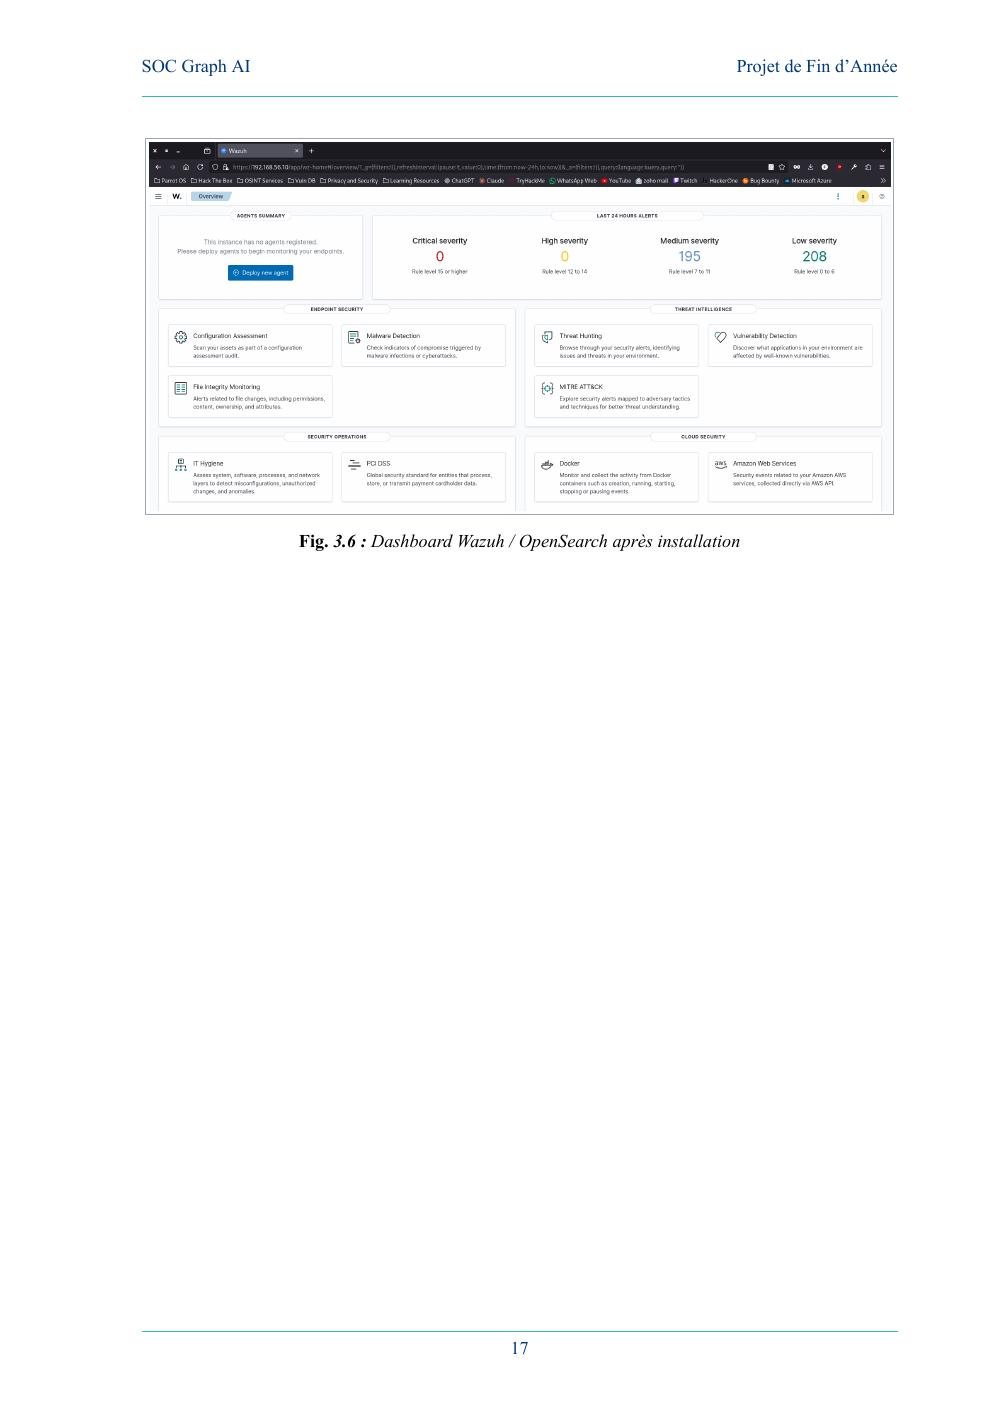
Windows was enriched with Sysmon so suspicious PowerShell, process execution, network activity and file operations could be investigated with more context than a default endpoint log source would provide.
4. Detection engineering and the 12 manual scenarios
I added local Wazuh rules for behaviors that were directly testable inside the laboratory. Examples include encoded PowerShell, suspicious PowerShell options, archive staging, scheduled-task persistence, Linux discovery, Caldera execution and pfSense blocked traffic.
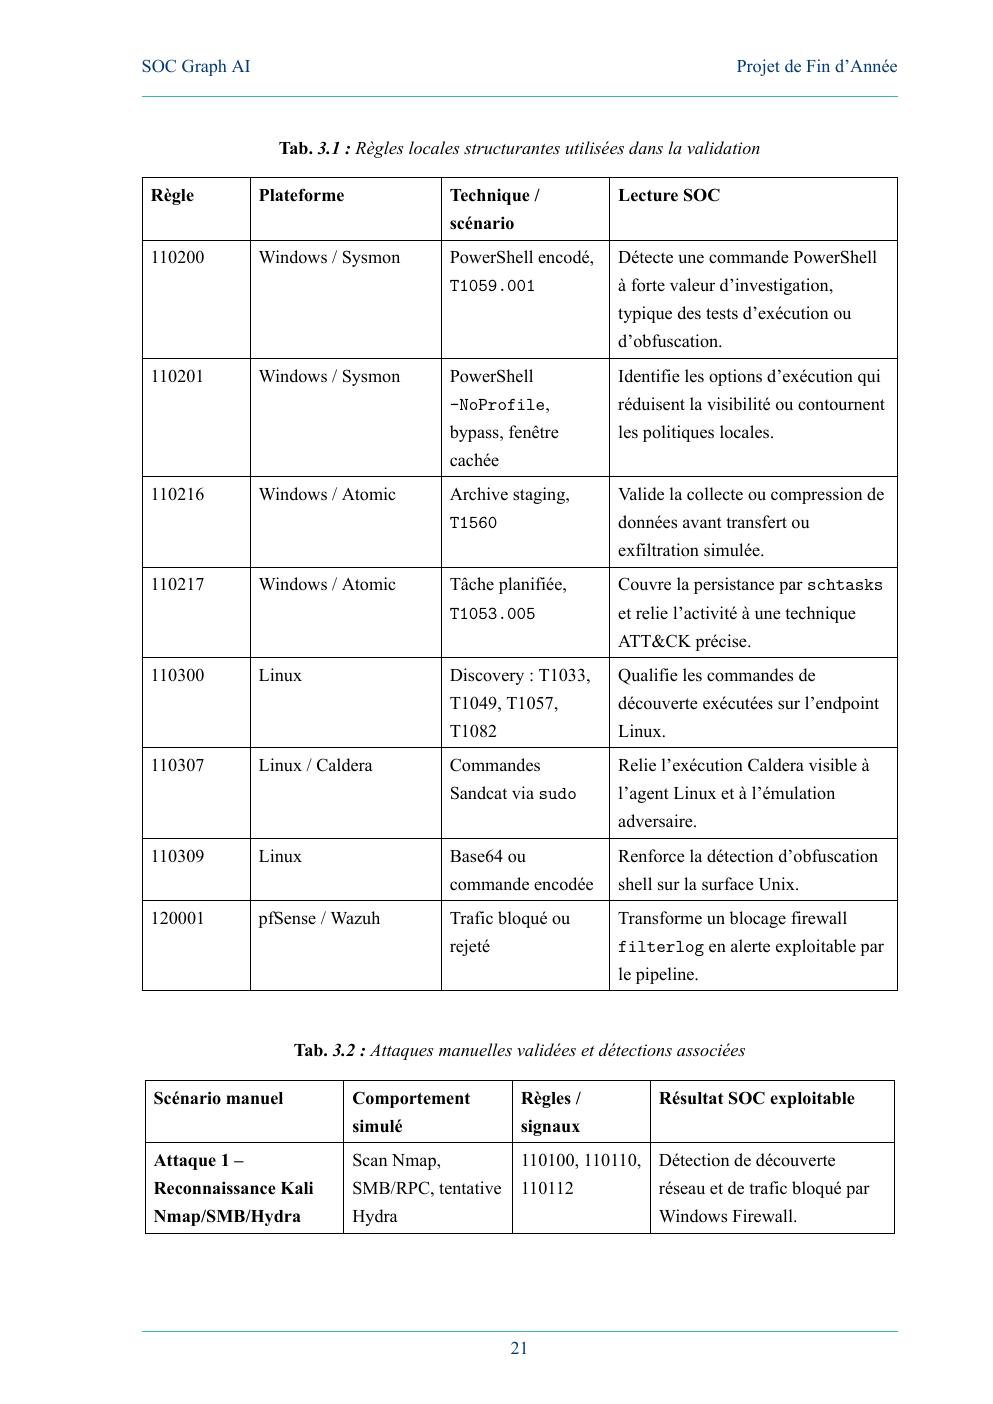
The twelve manual scenarios covered different phases of an attack lifecycle:
| # | Scenario | What I wanted to validate |
|---|---|---|
| 1 | Kali reconnaissance: Nmap / SMB / Hydra | discovery and network scanning visibility |
| 2 | PowerShell + LOLBins | suspicious native Windows execution and transfer preparation |
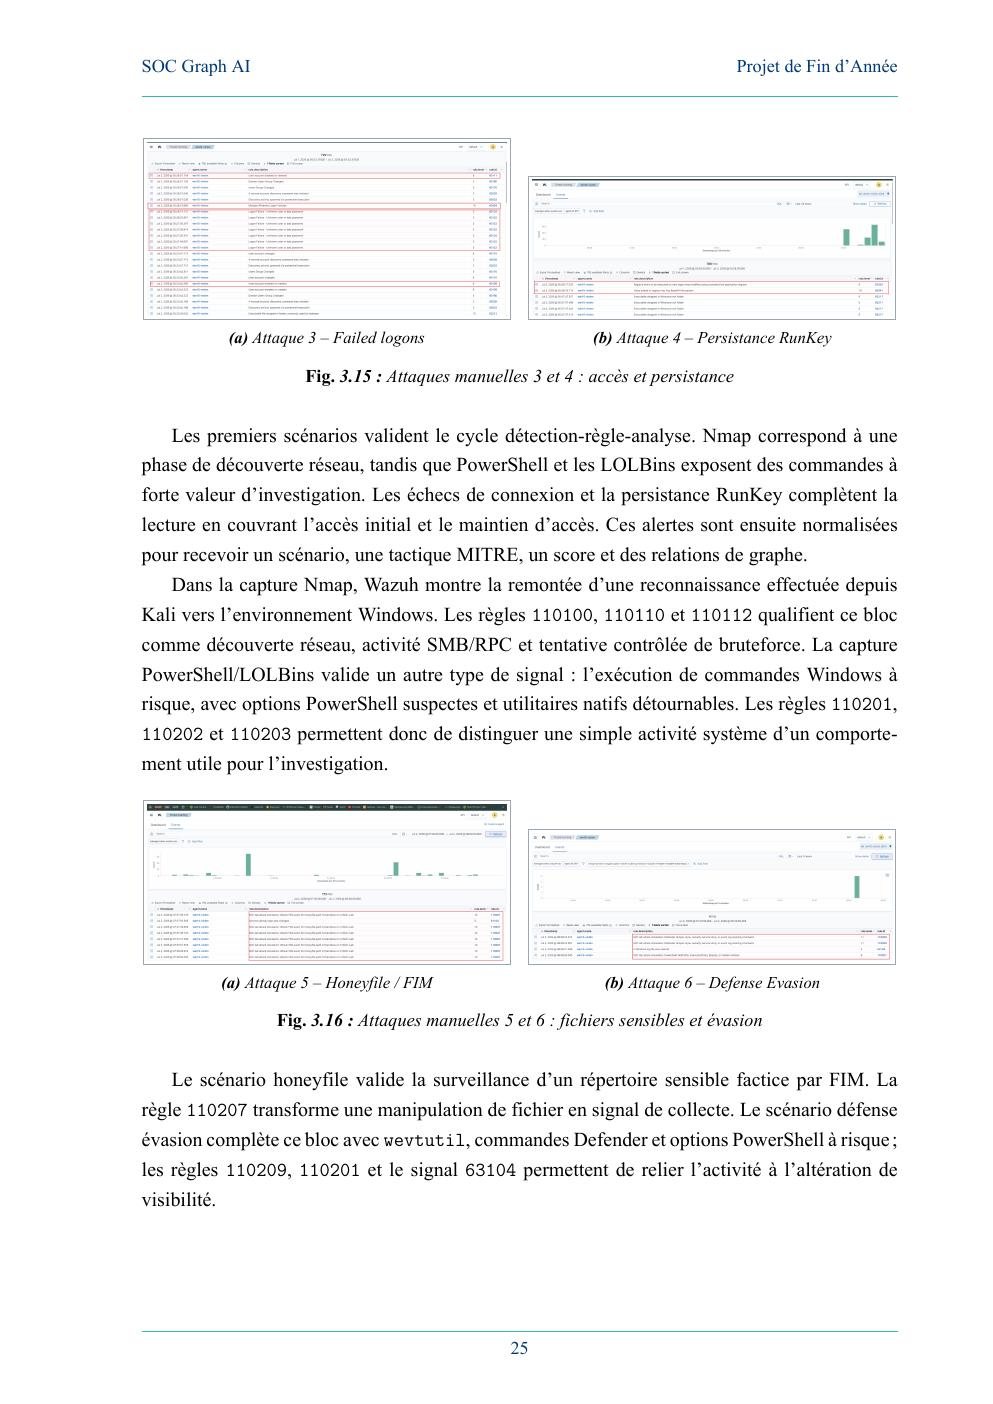
| 3 | Failed logons | controlled authentication failures / brute-force signal |
| 4 | RunKey / Scheduled Task | Windows persistence mechanisms |
| 5 | Honeyfile / FIM | sensitive-path file creation, modification and deletion |
| 6 | Defense evasion | log clearing, Defender-related commands and risky PowerShell |
| 7 | Archive staging | preparation of data before transfer |
| 8 | LSASS credential access | high-value credential-access behavior |
| 9 | Windows discovery | user, host, network and system enumeration |
| 10 | Lateral-movement preparation | WMIC, WinRM, scheduled tasks, remote-access preparation |
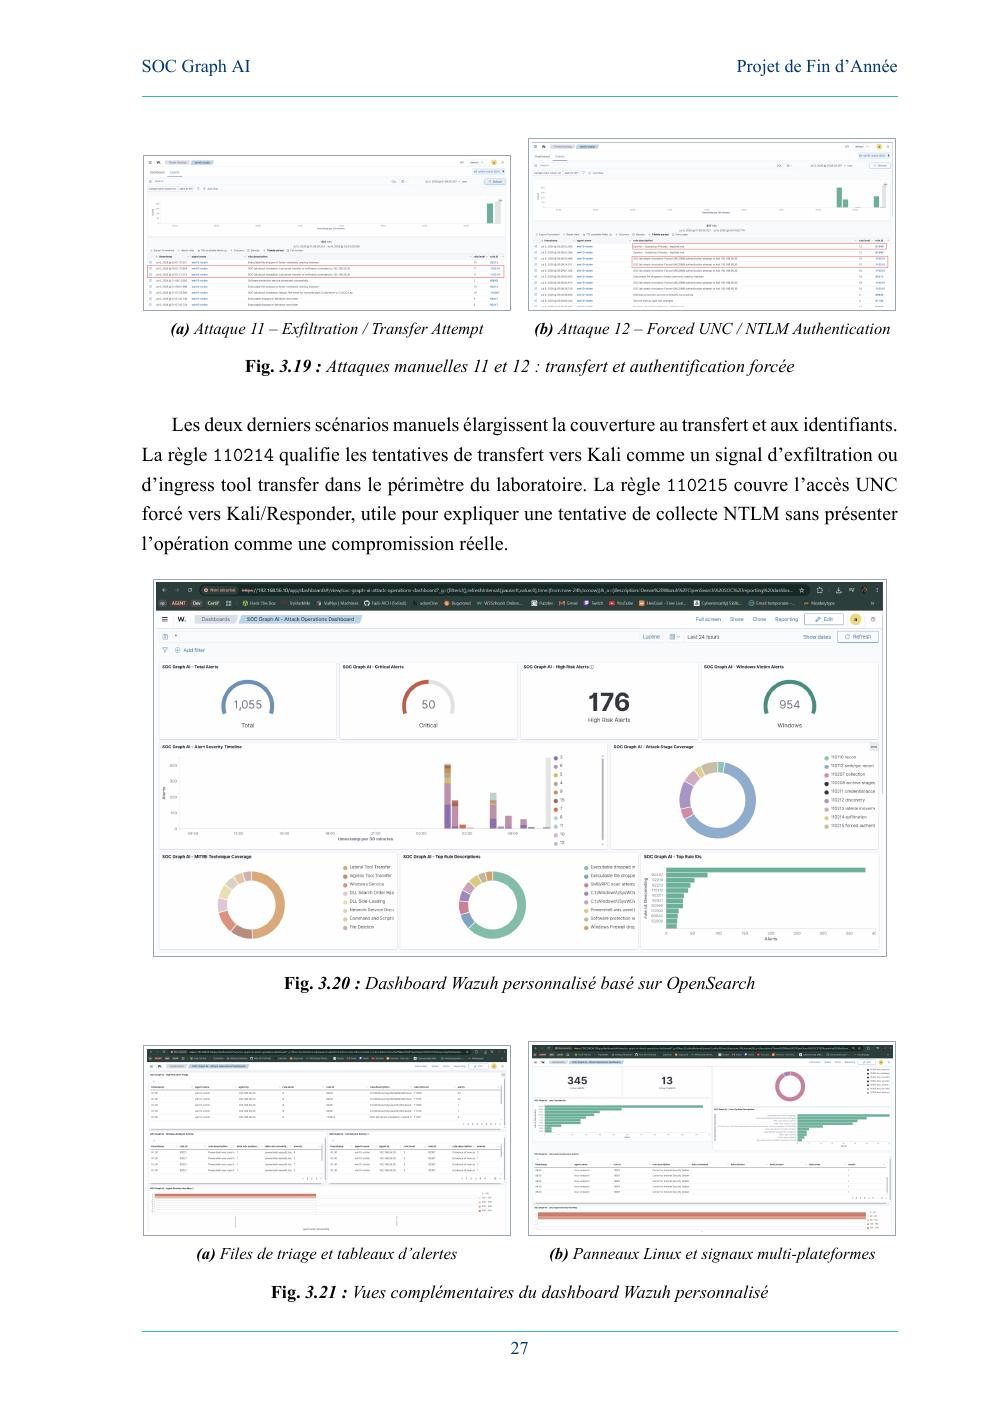
| 11 | Transfer / exfiltration attempt | controlled transfer toward the Kali system |
| 12 | Forced UNC / NTLM authentication | controlled credential-access signal toward Kali/Responder |
5. Python pipeline: from raw alerts to analyst-ready data
The pipeline does not replace Wazuh. Wazuh remains the source of detection evidence; Python makes the exported alerts consistent and reusable by the later analytics layers.
The normalization stage keeps the raw proof intact while extracting fields such as:
- timestamp and alert identifier;
- agent / host;
- Wazuh rule ID and level;
- scenario and attack stage;
- source and destination IP;
- process / command line where available;
- MITRE tactic and technique mapping;
- risk and enrichment fields.
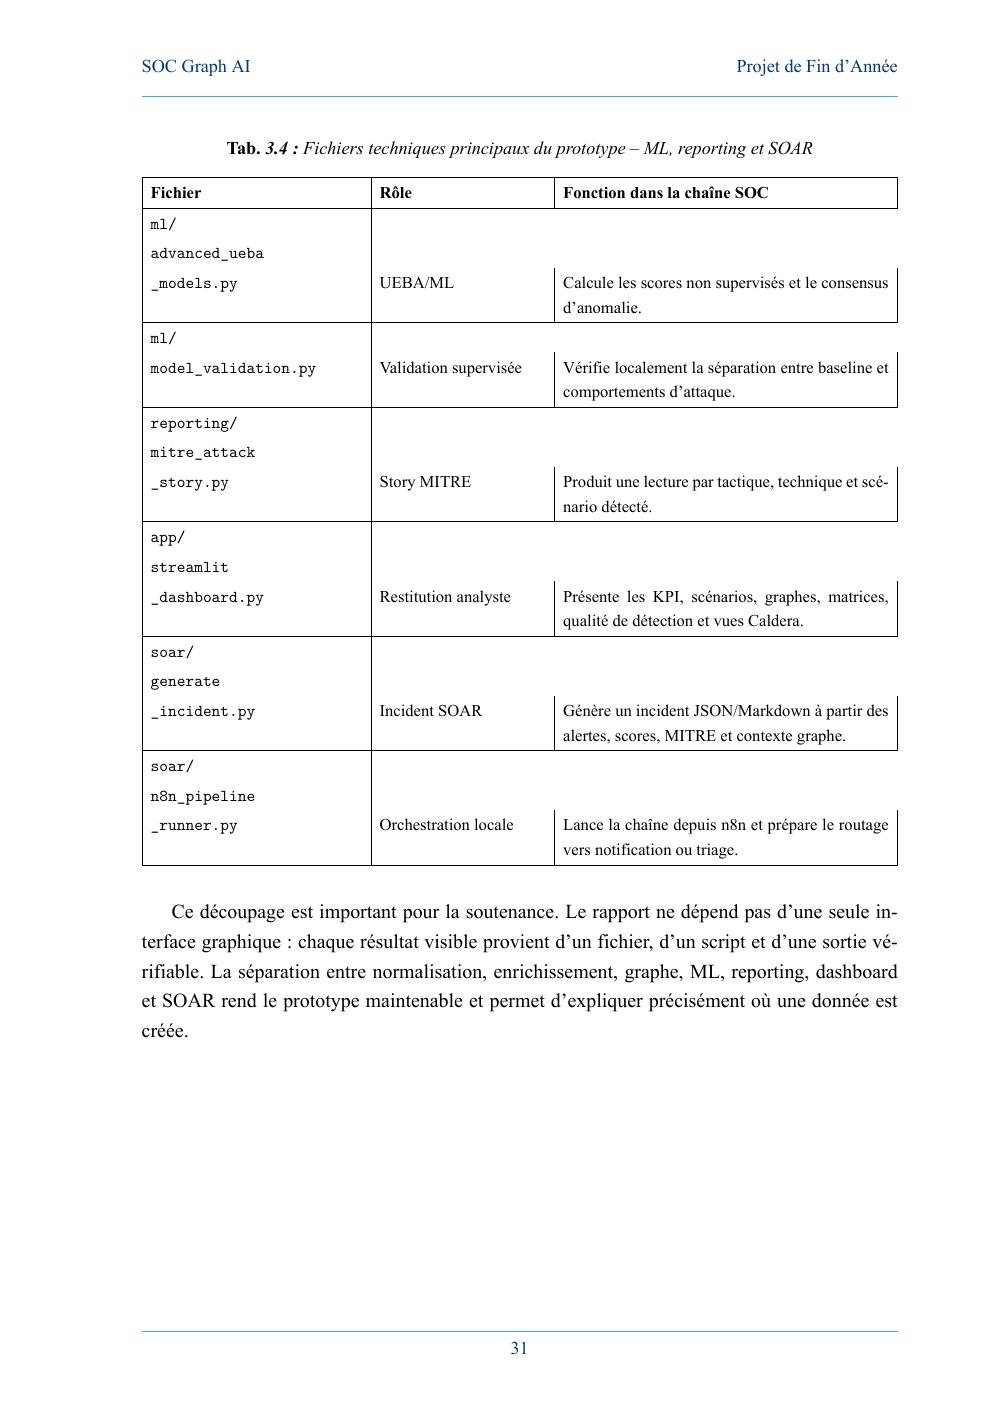
This modularity was intentional. It avoids building a demo that only works because one dashboard hides all the intermediate steps.
6. Graph AI with Neo4j
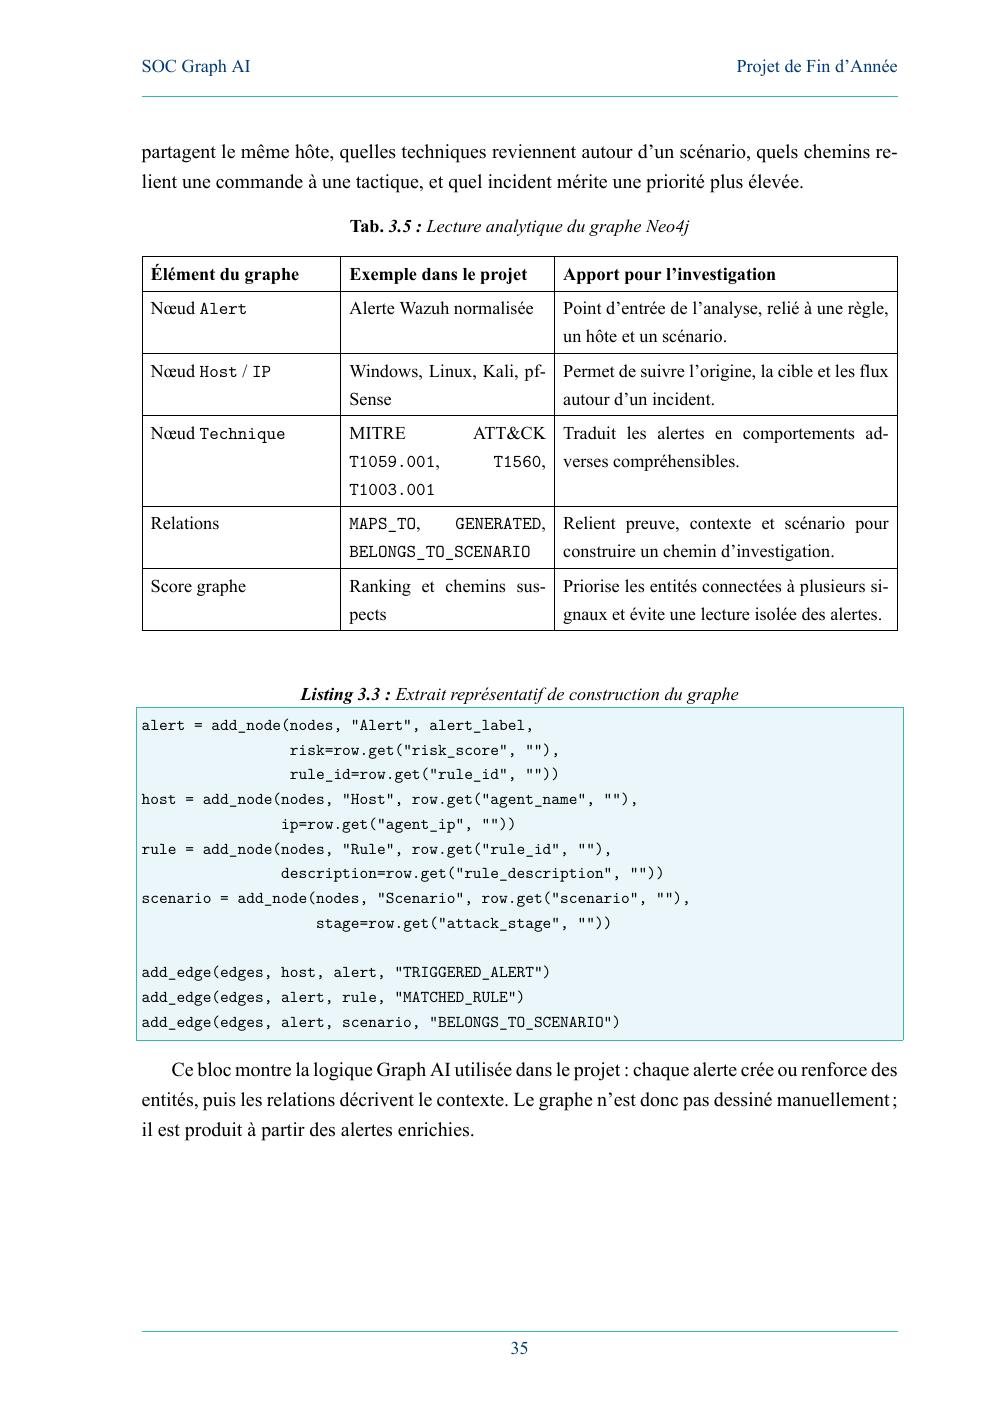
A flat alert table is useful for filtering, but it is weak at showing relationships. I modeled entities such as alerts, hosts, IPs, rules, processes, commands, scenarios and MITRE techniques as nodes, then connected them with relationships such as TRIGGERED_ALERT, MATCHED_RULE, MAPS_TO and BELONGS_TO_SCENARIO.
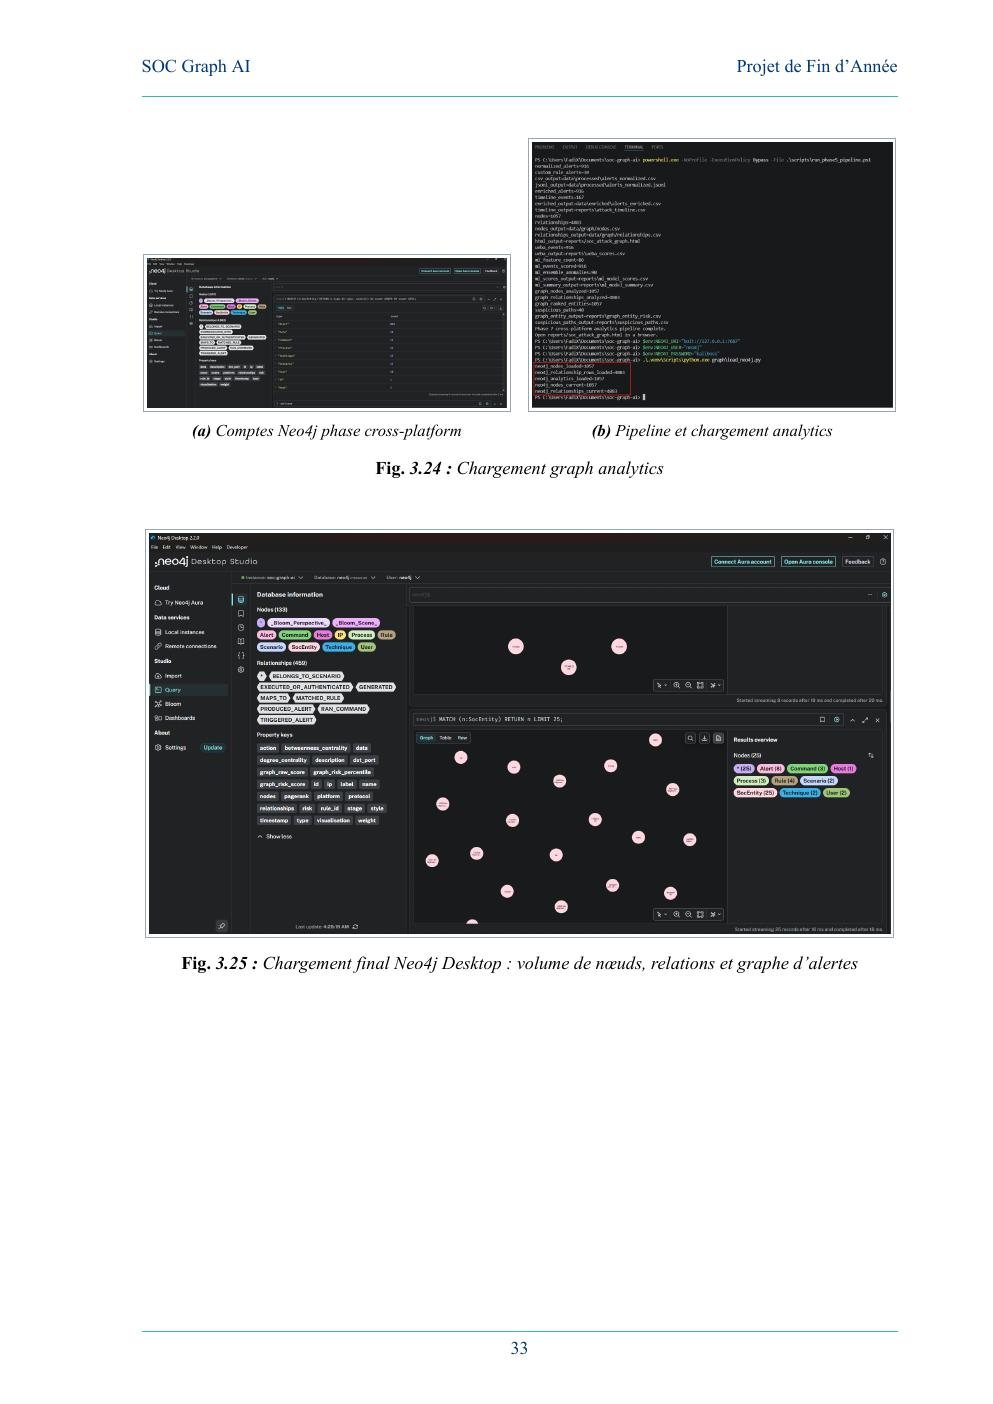
The graph gives an analyst questions that are difficult to answer cleanly from a flat list:
- Which alerts share the same host or IP?
- Which MITRE techniques cluster around one scenario?
- Which command is connected to a high-risk alert?
- Which entities appear repeatedly across several signals?
- Which investigation paths should be reviewed first?
7. UEBA / ML prioritization
The ML layer is deliberately positioned as prioritization assistance, not as a production-ready autonomous detector.
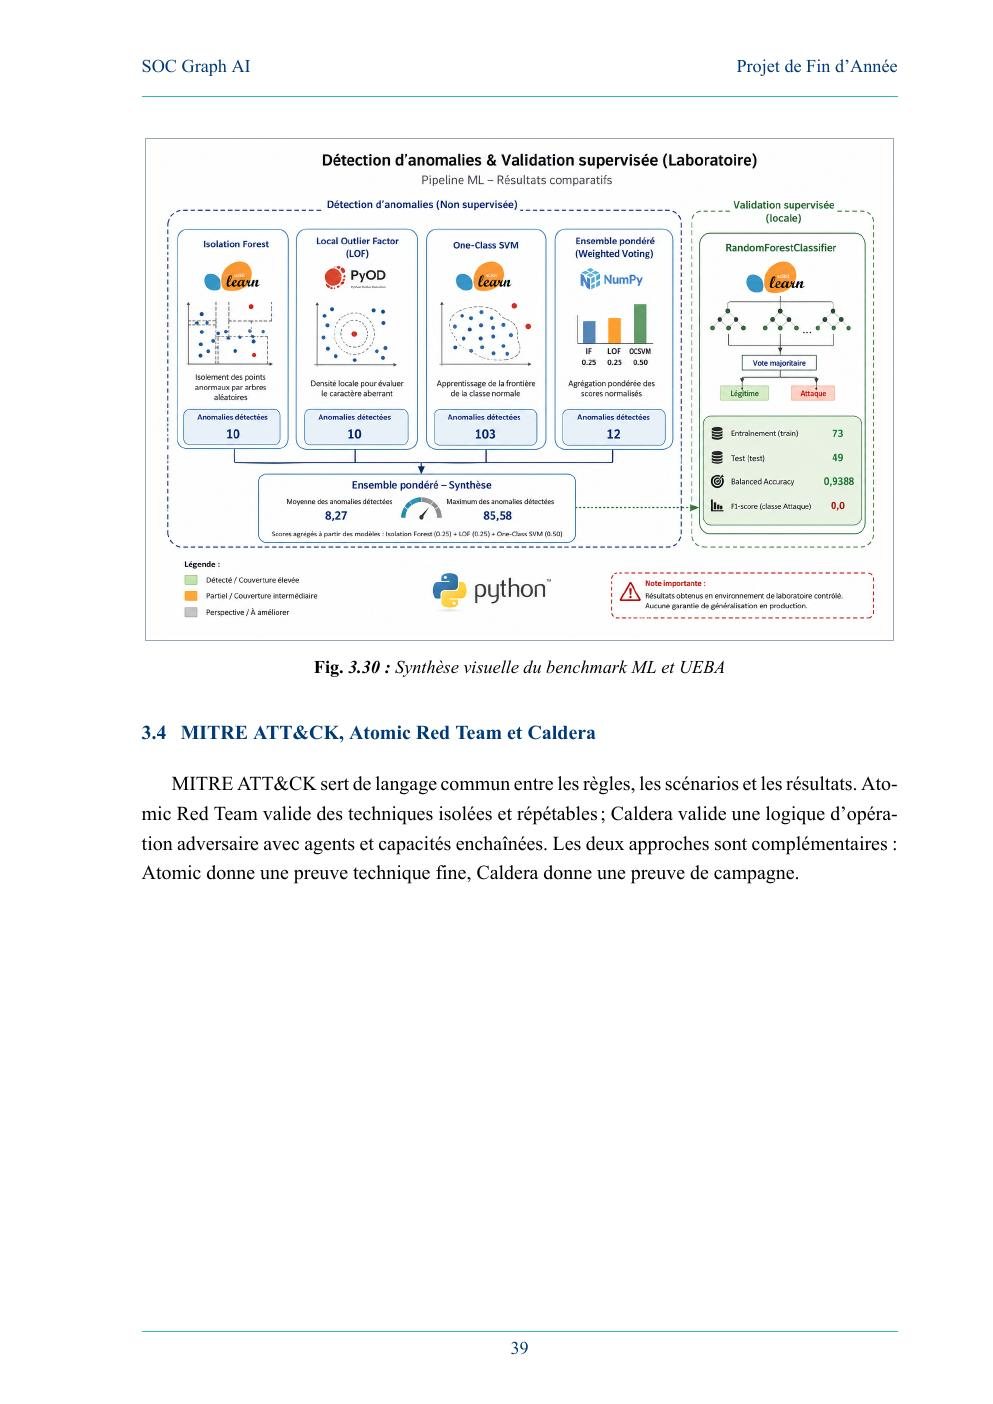
The unsupervised ensemble combines:
- Isolation Forest — 40%
- Local Outlier Factor — 30%
- One-Class SVM — 30%
A consensus vote and ensemble score are translated into analyst-friendly labels such as baseline, watch and anomalous.
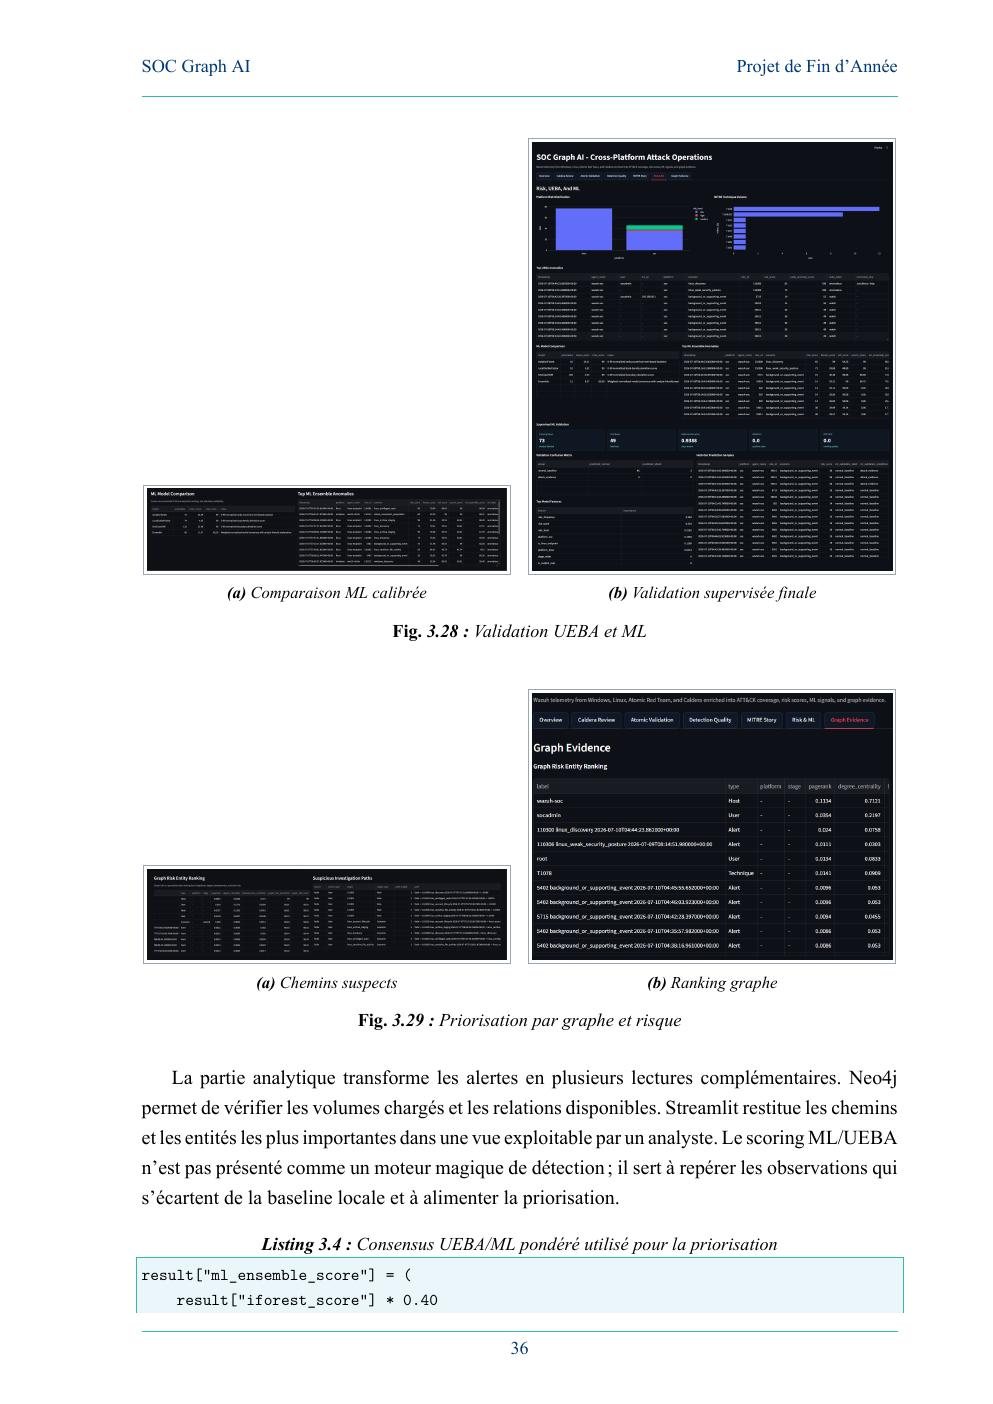
For local supervised validation, a Random Forest was trained only on local TP and TN_BASELINE labels. The latest pipeline split used 73 training rows and 49 test rows and achieved a balanced accuracy of 0.9388. Because attack samples remained limited, I treat this strictly as a validation of the local method—not evidence of generalization to production traffic.
8. MITRE ATT&CK, Atomic Red Team and Caldera
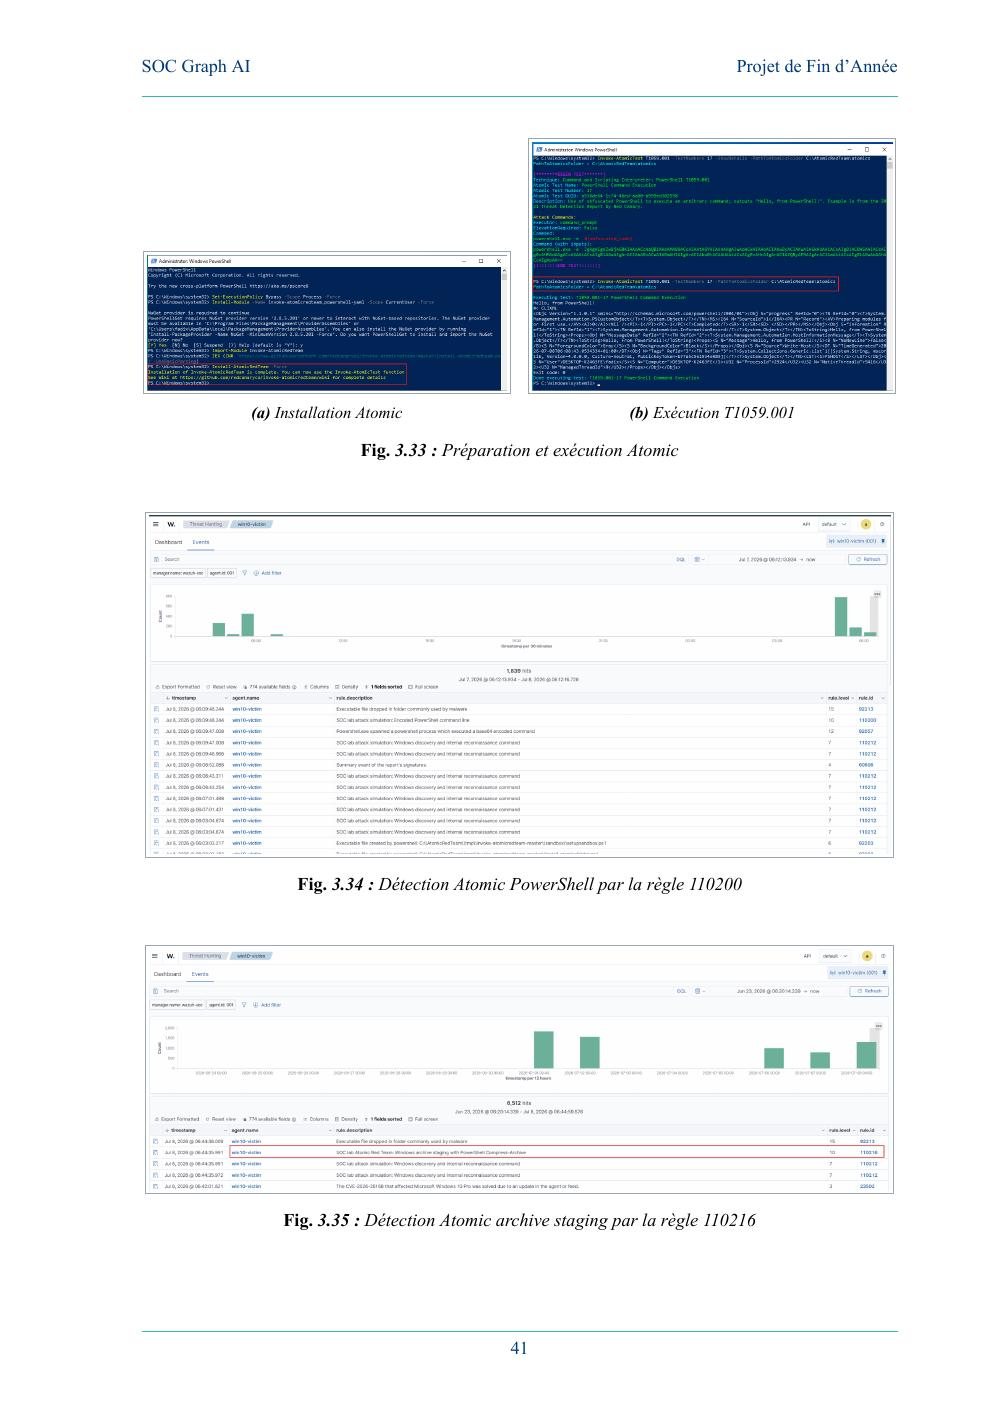
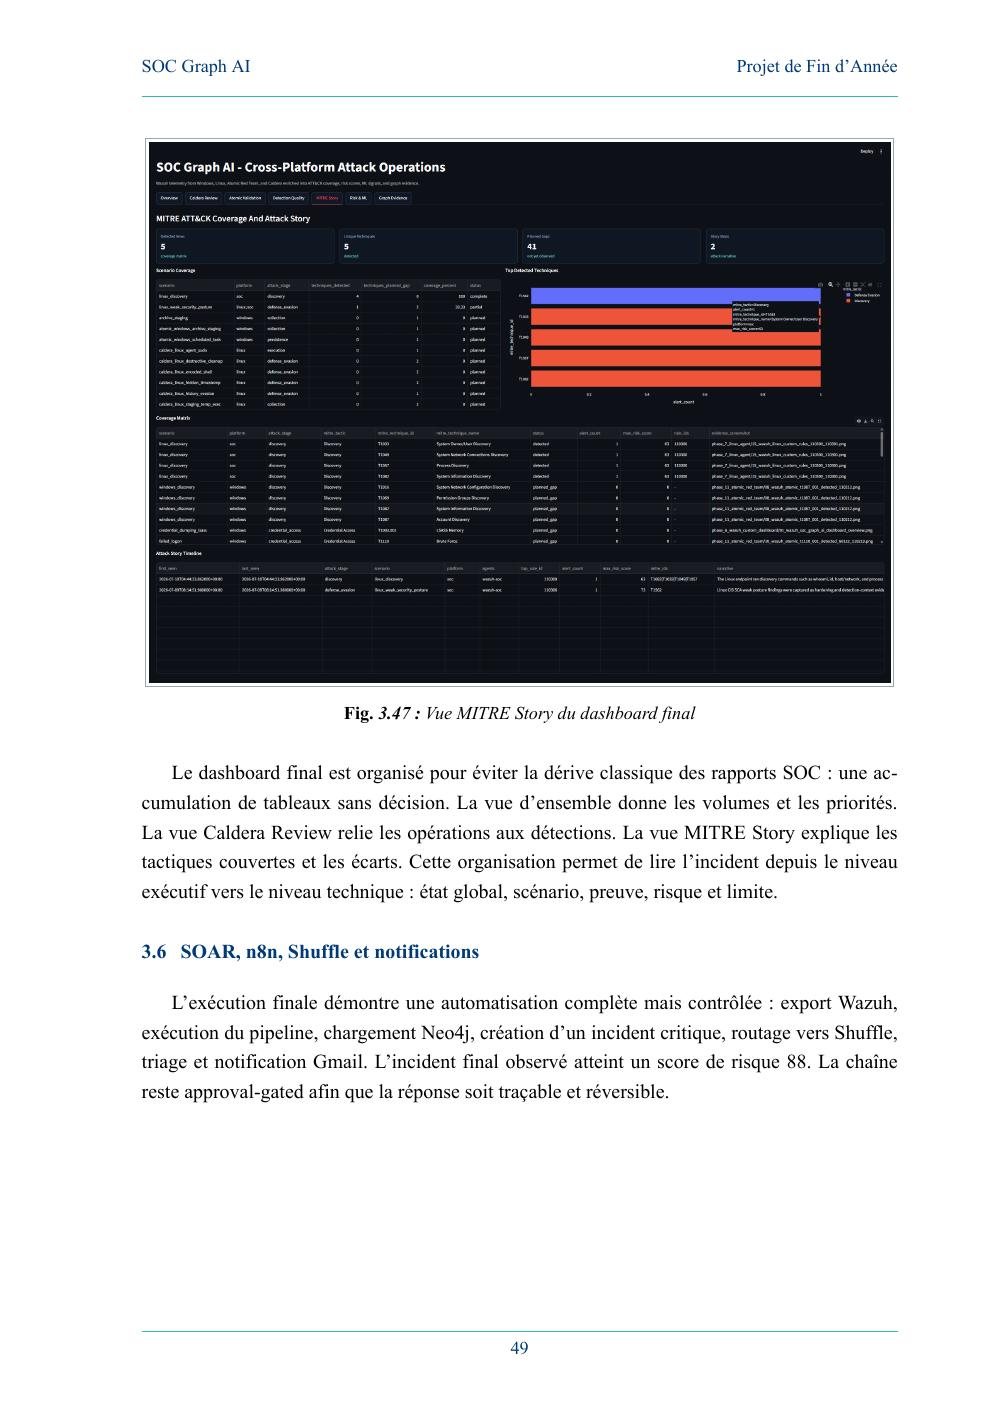
MITRE ATT&CK provides the common language used to connect rules, behaviors and analyst interpretation.
I used two complementary validation approaches:
- Atomic Red Team for repeatable tests of individual techniques.
- MITRE Caldera for multi-step operations with agents, abilities and chained activity.
Atomic tests included PowerShell T1059.001, archive staging T1560, account discovery T1087.001, password guessing T1110.001 and scheduled task T1053.005.
Caldera then expanded the test scope to multi-host operations including discovery, collection, Windows enumeration, defense evasion and credential access.
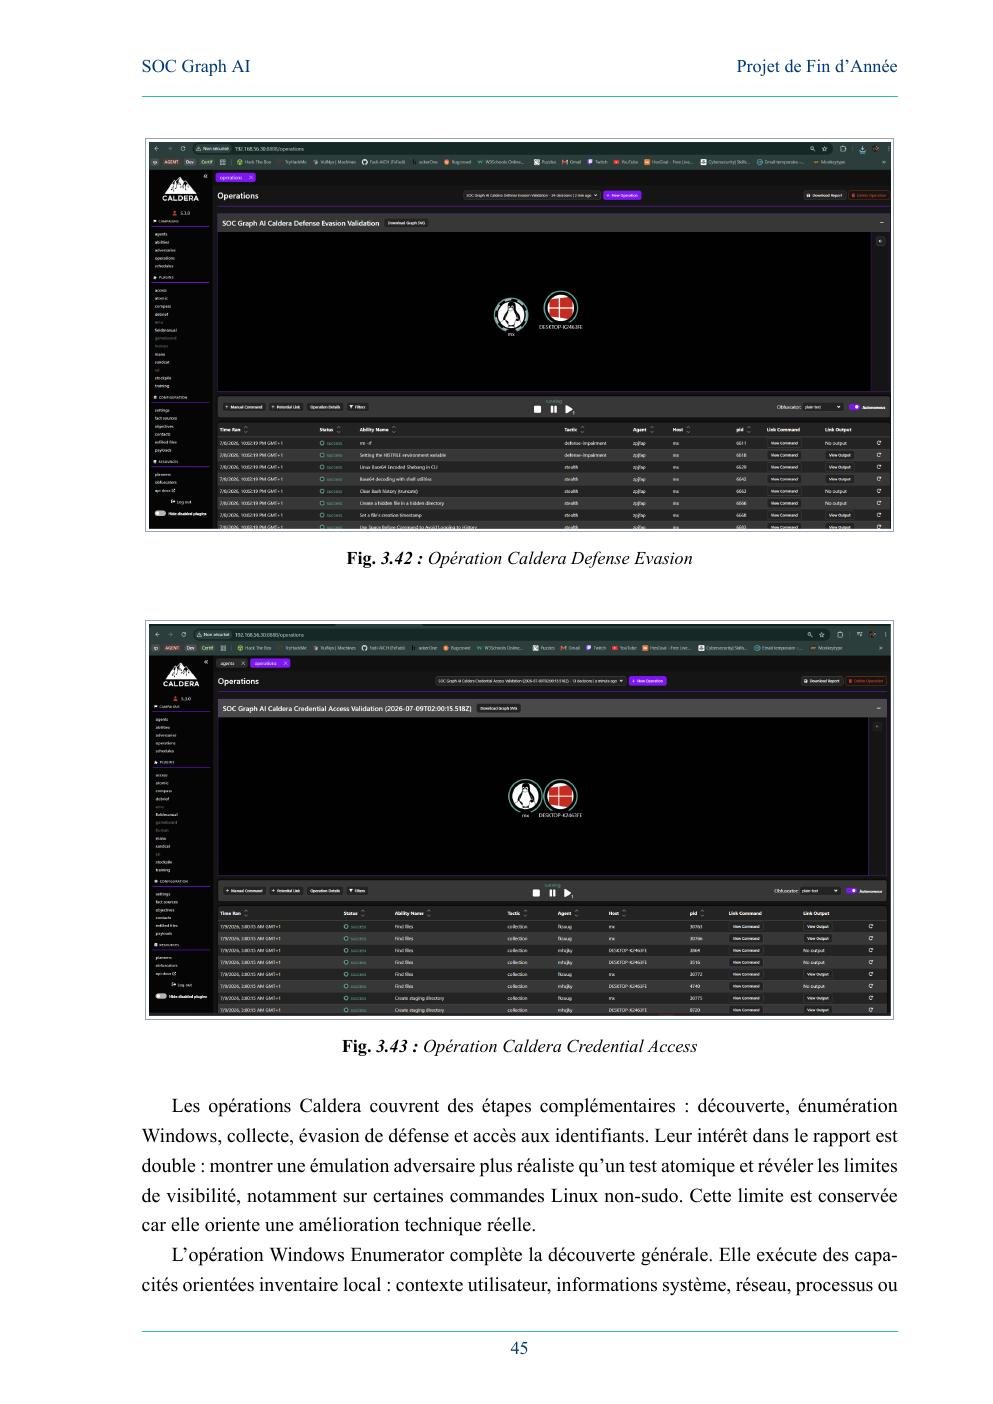
A useful result of this stage was not only what worked, but also what did not: some Linux Caldera commands that were not executed through sudo did not provide complete command-line visibility. I kept that limitation explicit instead of hiding it.
9. Analyst dashboard
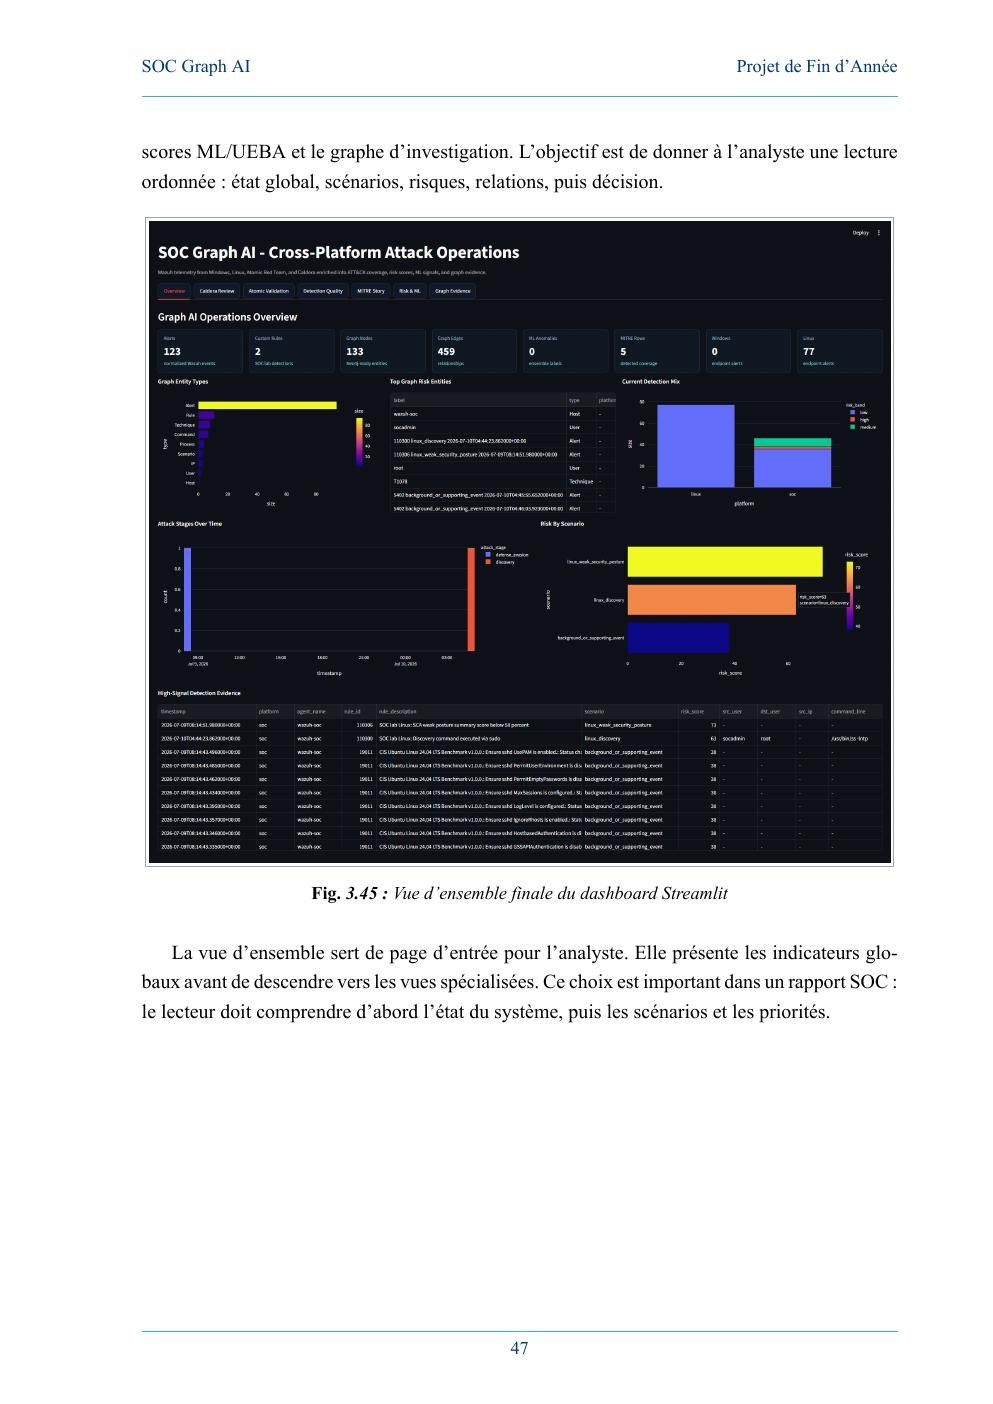
Streamlit is the presentation layer for the enriched evidence. It is organized so the analyst moves from global state to technical detail rather than being dropped directly into raw screenshots or tables.
The main views include:
- overall indicators and alert volumes;
- scenario review;
- Caldera operation review;
- MITRE story / coverage;
- detection quality;
- risk and ML prioritization;
- graph evidence and suspicious paths.
10. SOAR: n8n, Shuffle and controlled response
The orchestration layer was designed with a security constraint: automate qualification and routing, not silent destructive actions.
The workflow performs:
- Wazuh export.
- Local runner execution.
- Python pipeline processing.
- Neo4j loading.
- Incident generation from enriched alerts.
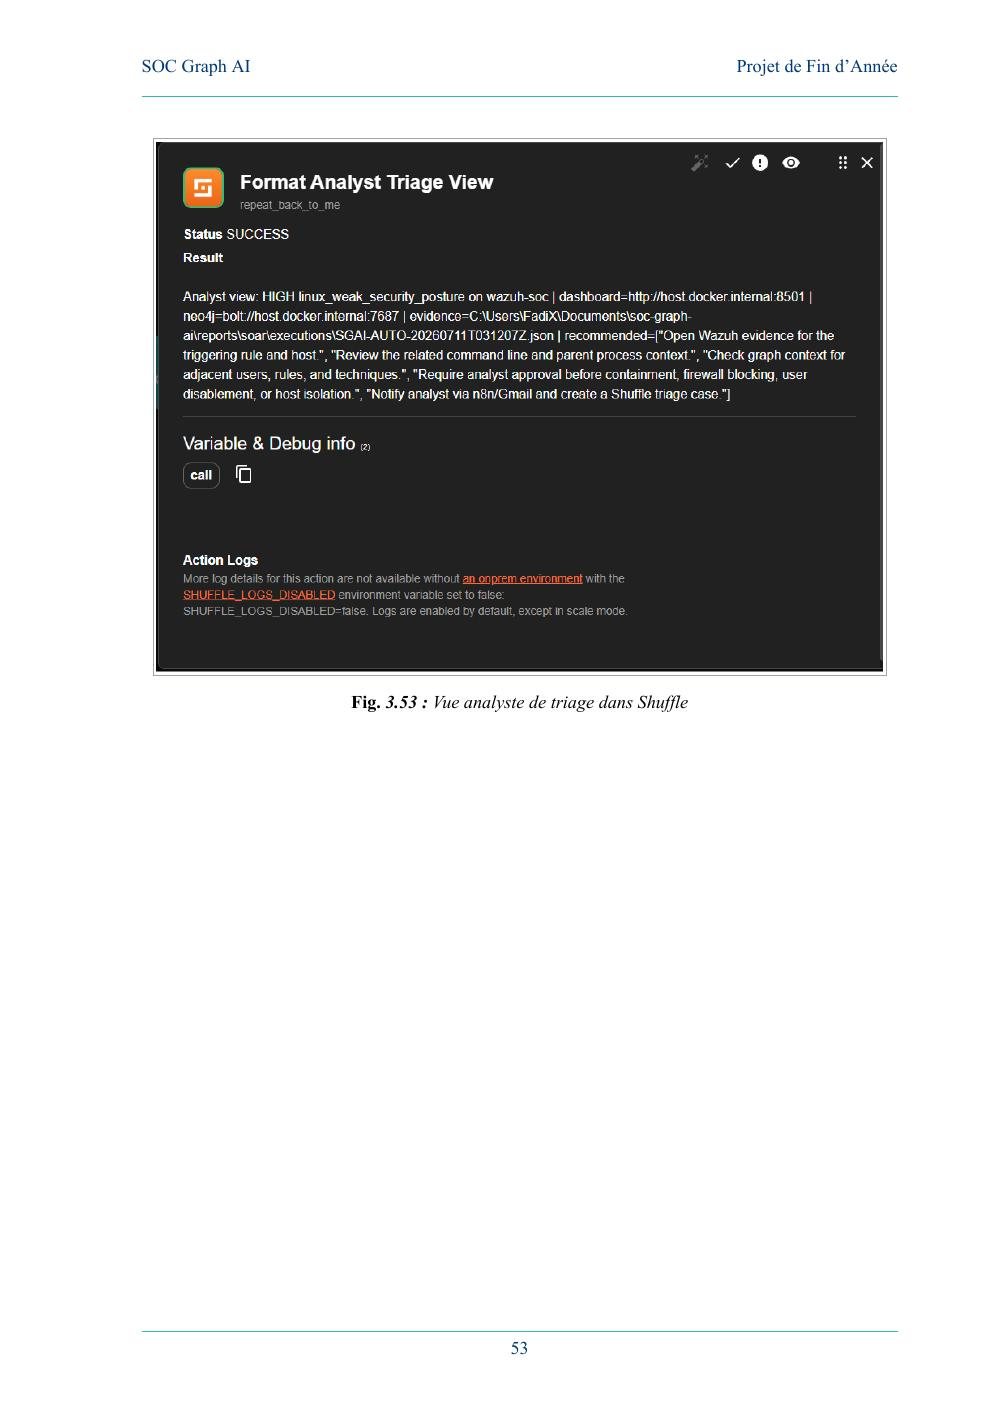
- Routing into Shuffle.
- Analyst triage.
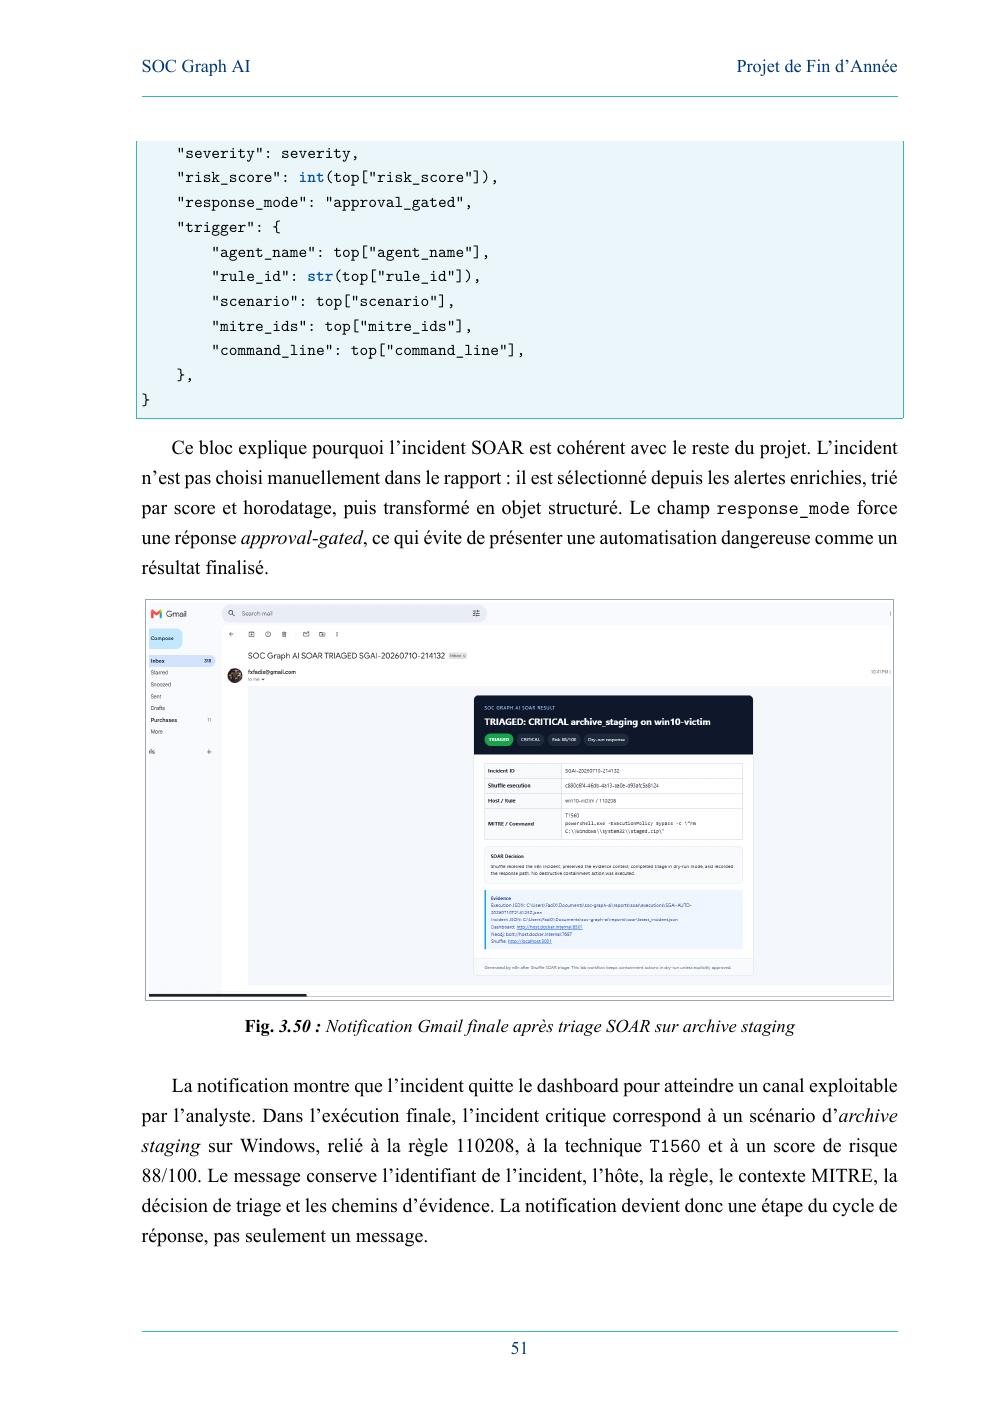
- Final Gmail notification.
The final validated critical incident was an archive-staging scenario on Windows, mapped to rule 110208, MITRE T1560, with a risk score of 88/100.
11. What the project validated
The final result is a connected SOC chain rather than a collection of independent tools:
- multi-source telemetry from Windows, Linux and pfSense;
- custom Wazuh detection logic;
- twelve manually controlled attack scenarios;
- reproducible Atomic Red Team technique validation;
- Caldera multi-host adversary emulation;
- 1,396 final alerts processed into structured outputs;
- MITRE enrichment and attack-story reporting;
- Neo4j graph nodes, relations, paths and rankings;
- local UEBA/ML prioritization;
- analyst-facing Streamlit views;
- n8n + Shuffle incident orchestration and notification.
12. Limitations and what I would improve next
The main limits I kept explicit are:
- ML validation is local to the laboratory and dataset.
- Linux command-line visibility is incomplete for some Caldera activity without stronger
execveauditing. - ATT&CK coverage is intentionally partial and evidence-based.
- Automated pfSense blocking was not claimed as completed; a production implementation would require dedicated credentials, analyst approval, rollback and audit controls.
- A production rollout would require broader data volumes, longer baselines, tuning, access-control hardening, secret management and operational runbooks.
The strongest lesson from this project was that SOC engineering is not about collecting the largest number of tools. The value comes from making the evidence chain understandable, reproducible and safe enough for an analyst to trust.