CyberGuard MLOps — IoT Intrusion Detection Platform
CyberGuard MLOps is an end-to-end IoT intrusion-detection project built to go beyond a notebook that trains a model once. The system covers data ingestion and validation, reproducible training, experiment tracking, model registration, API serving, production-style monitoring, orchestration, drift analysis and an analyst-facing SOC workflow.
1. Architecture
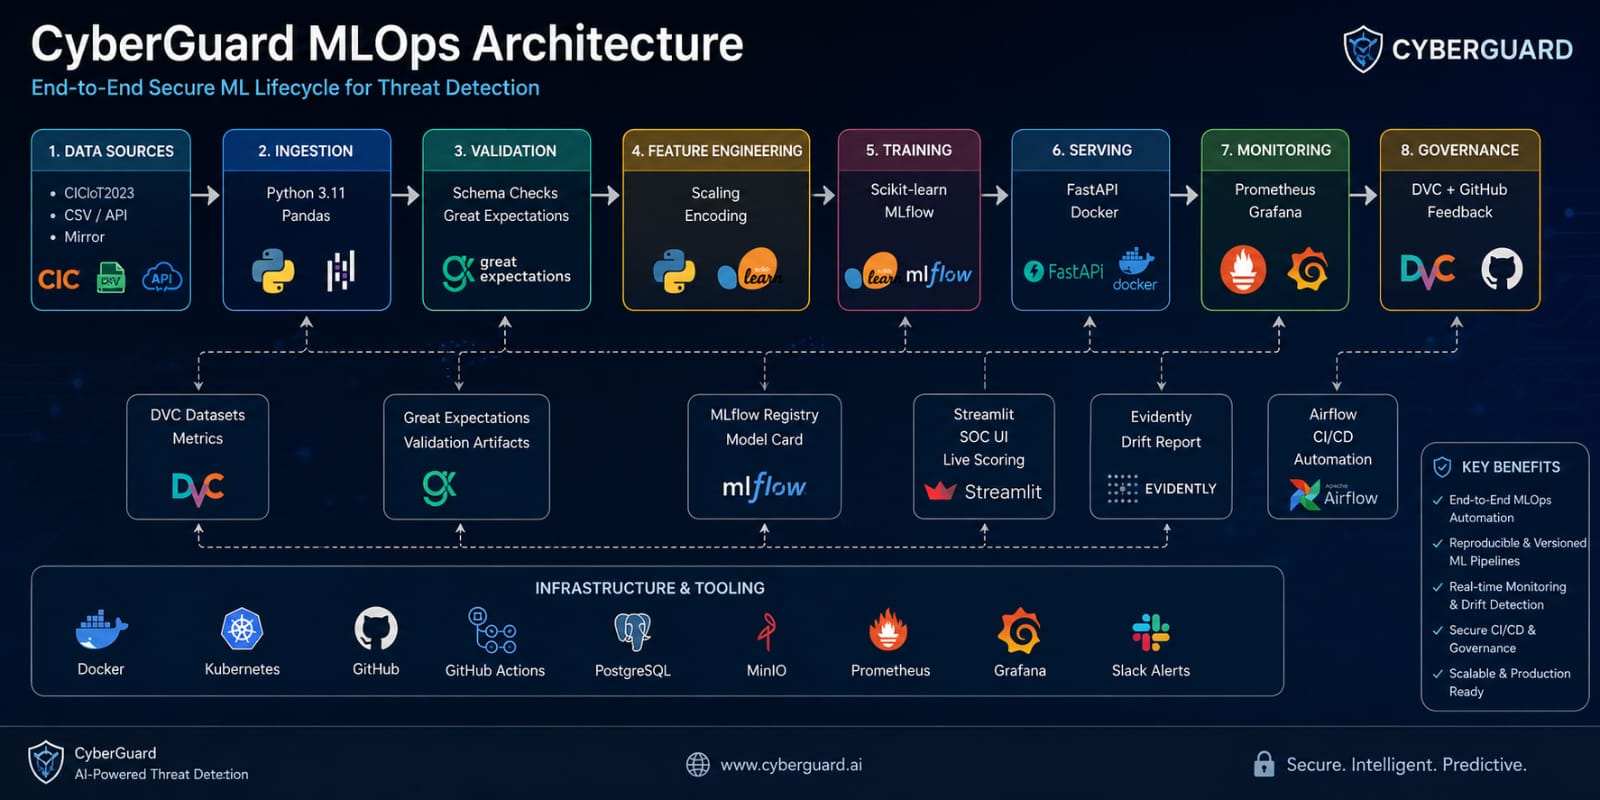
The architecture connects the machine-learning lifecycle to the operational security lifecycle. Data is ingested and validated, the training pipeline is reproducible with DVC, experiments are tracked with MLflow, the selected model is served through FastAPI, and production-style signals are exposed to Prometheus and Grafana. Airflow orchestrates the workflow while Streamlit gives the analyst a separate interface for triage and evidence review.
2. Data ingestion and validation
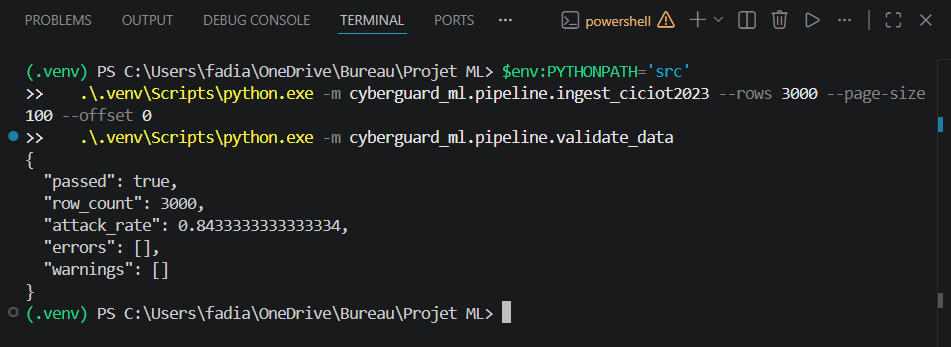
The project uses a reproducible sample from the public CICIoT2023 IoT intrusion-detection dataset rather than claiming results on the complete benchmark. The ingestion stage creates the local dataset used by the rest of the pipeline, then validation checks confirm that the expected schema and basic data assumptions hold before training.
Data-quality work includes schema validation and Great Expectations artifacts. This is important because a model pipeline should fail visibly when the data contract changes instead of silently training on malformed input.
3. Reproducibility with DVC
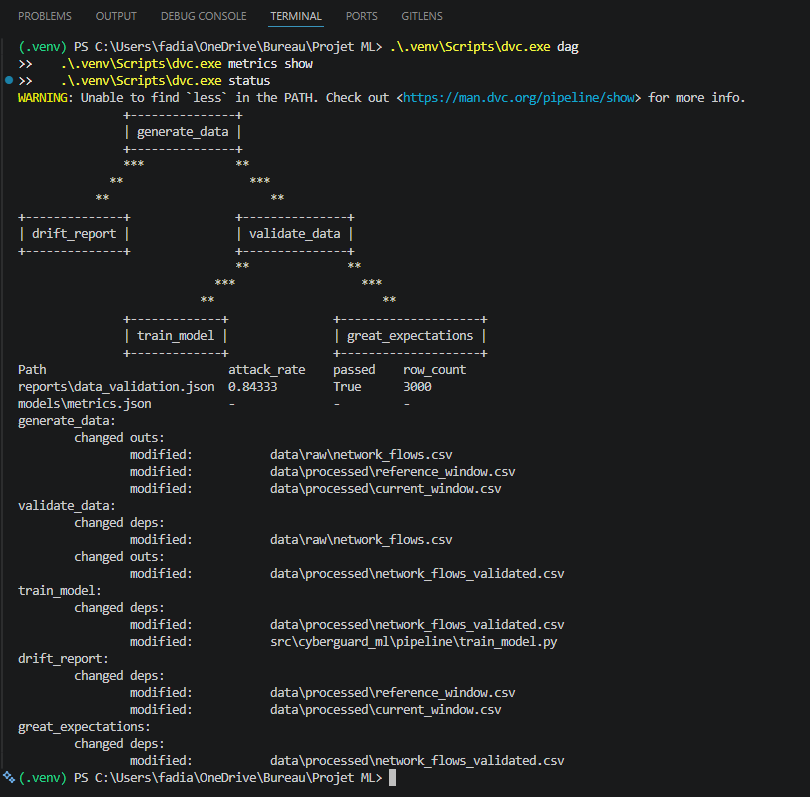
DVC is used to make the sequence of data preparation, validation, training and reporting reproducible. Instead of manually running unrelated scripts, the project exposes a dependency graph and versioned metrics that can be regenerated with dvc repro.
This provides three useful properties:
- changes in data or code can trigger the appropriate downstream stages;
- model results are tied to the versioned pipeline state;
- another run can reproduce the same sequence instead of relying on a one-off notebook session.
4. Model training and comparison
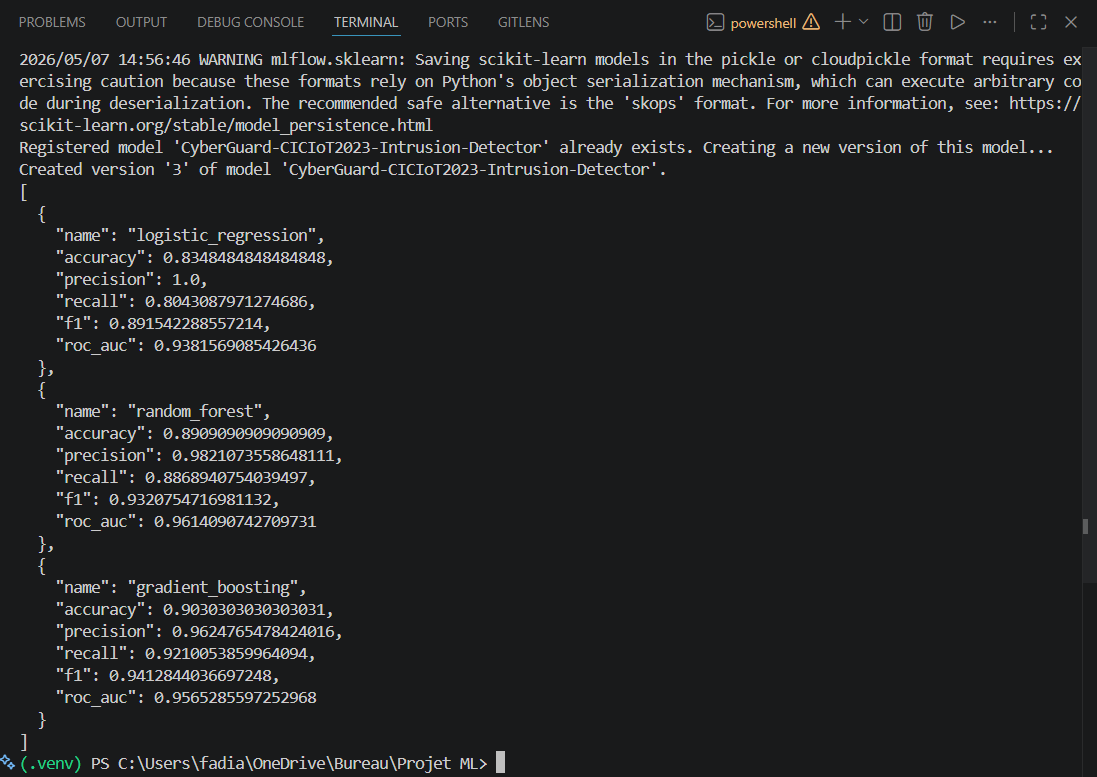
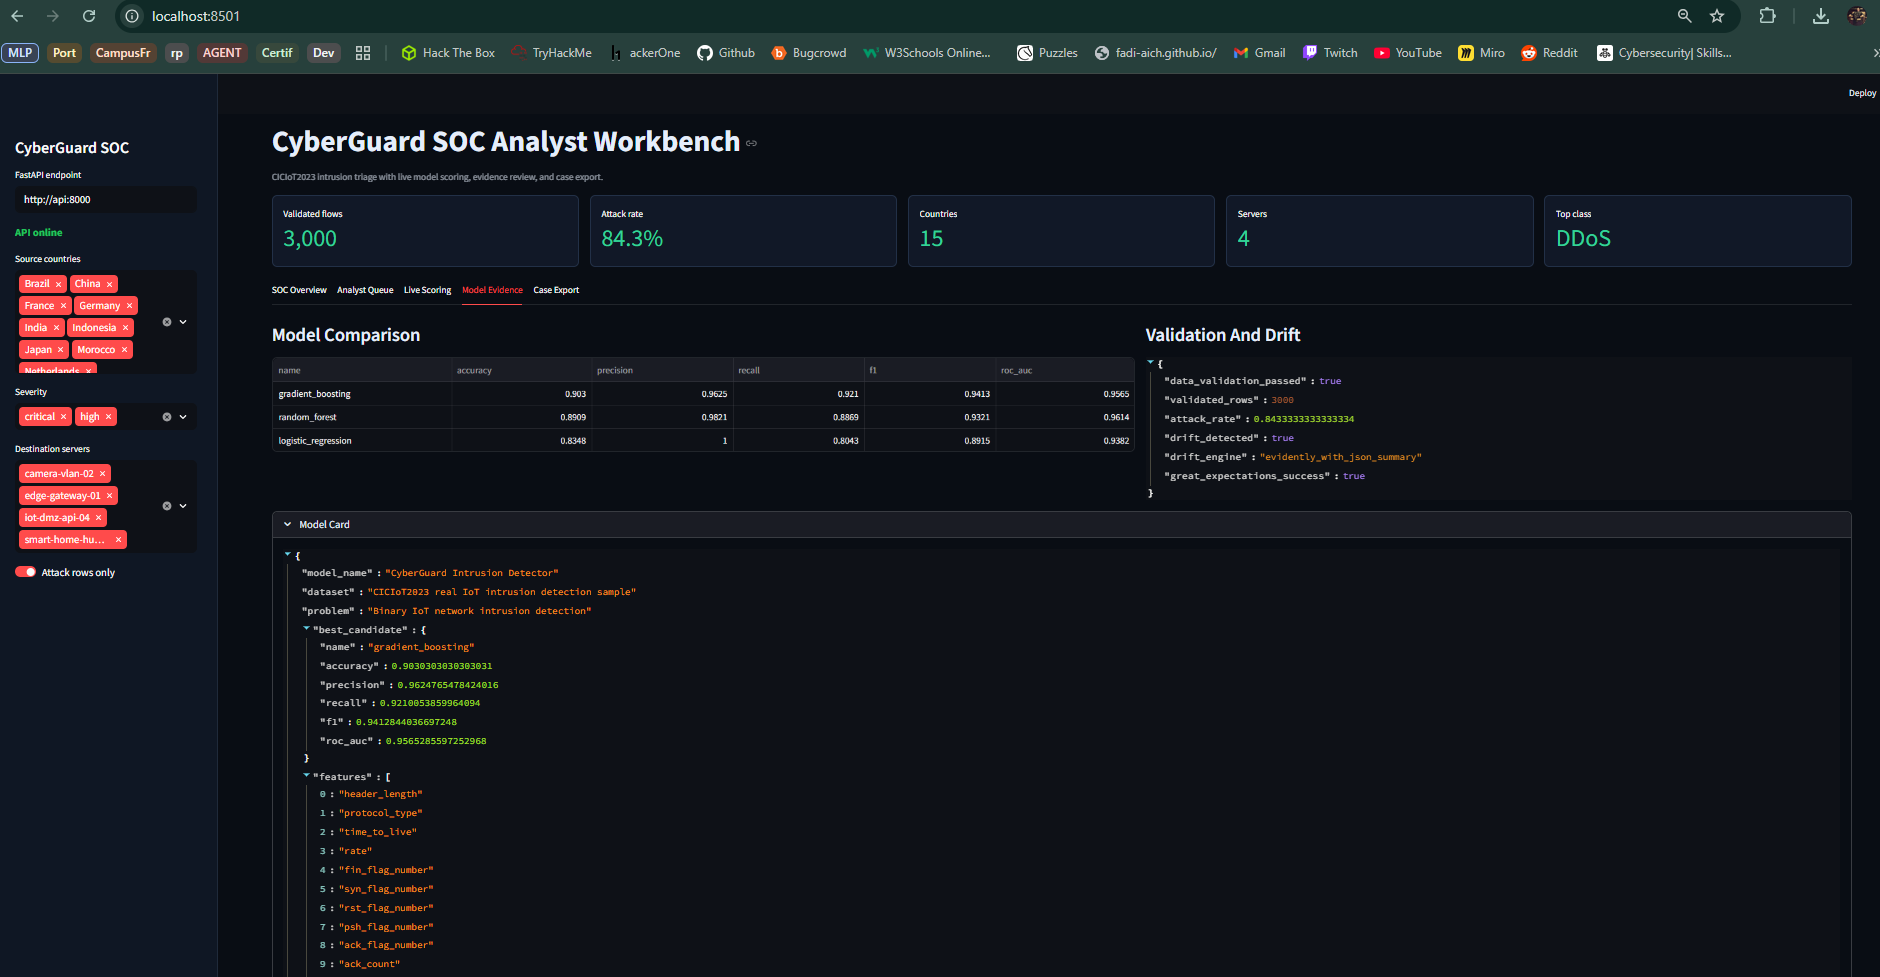
Three classical supervised models were compared on the project sample: Logistic Regression, Random Forest and Gradient Boosting. The final model was selected by F1-score.
| Model | Accuracy | Precision | Recall | F1 | ROC-AUC |
|---|---|---|---|---|---|
| Logistic Regression | 0.835 | 1.000 | 0.804 | 0.892 | 0.938 |
| Random Forest | 0.891 | 0.982 | 0.887 | 0.932 | 0.961 |
| Gradient Boosting | 0.903 | 0.962 | 0.921 | 0.941 | 0.956 |
Gradient Boosting was selected because its F1 of 0.941 provided the best balance on the project sample. I keep the wording deliberately narrow: these are project-sample results, not a claim that the model establishes a new CICIoT2023 benchmark.
5. Experiment tracking and model registry
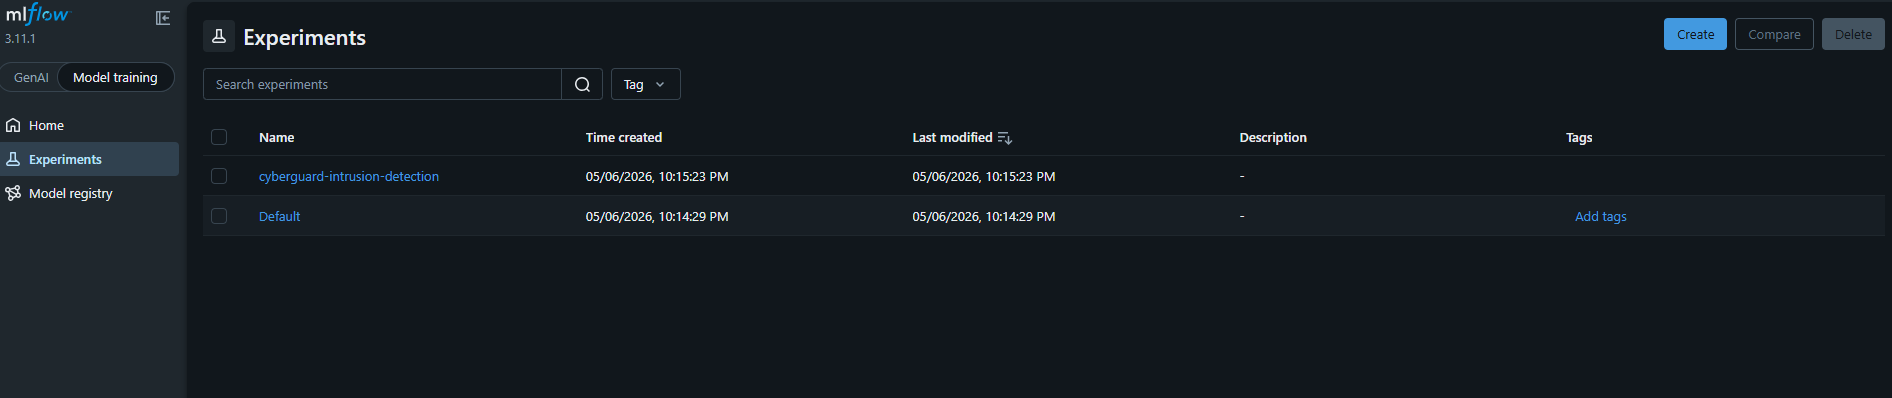
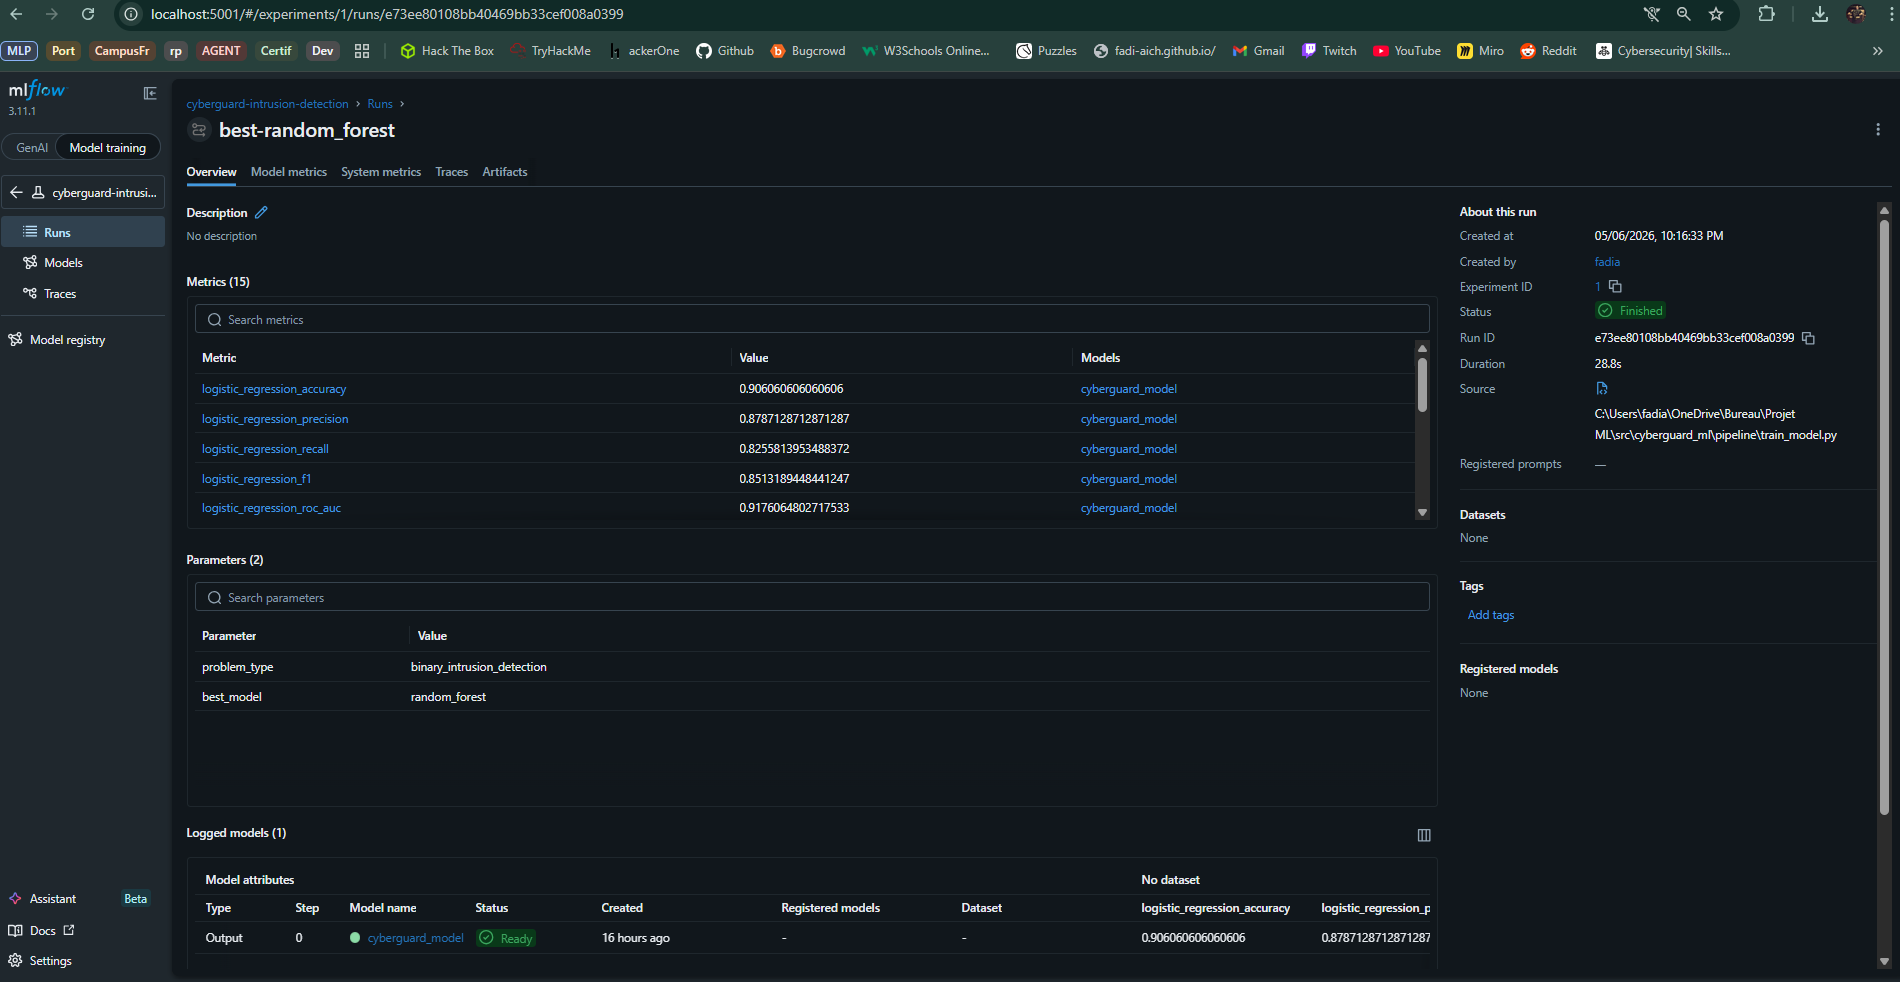
MLflow records experiments, metrics and model artifacts. That gives a direct audit trail between a training run and the model that is eventually served.
The registry layer matters because the API should not depend on an unexplained .pkl file copied into a folder. A registered model carries experiment context and makes the relationship between training and serving easier to inspect.
6. Serving with FastAPI
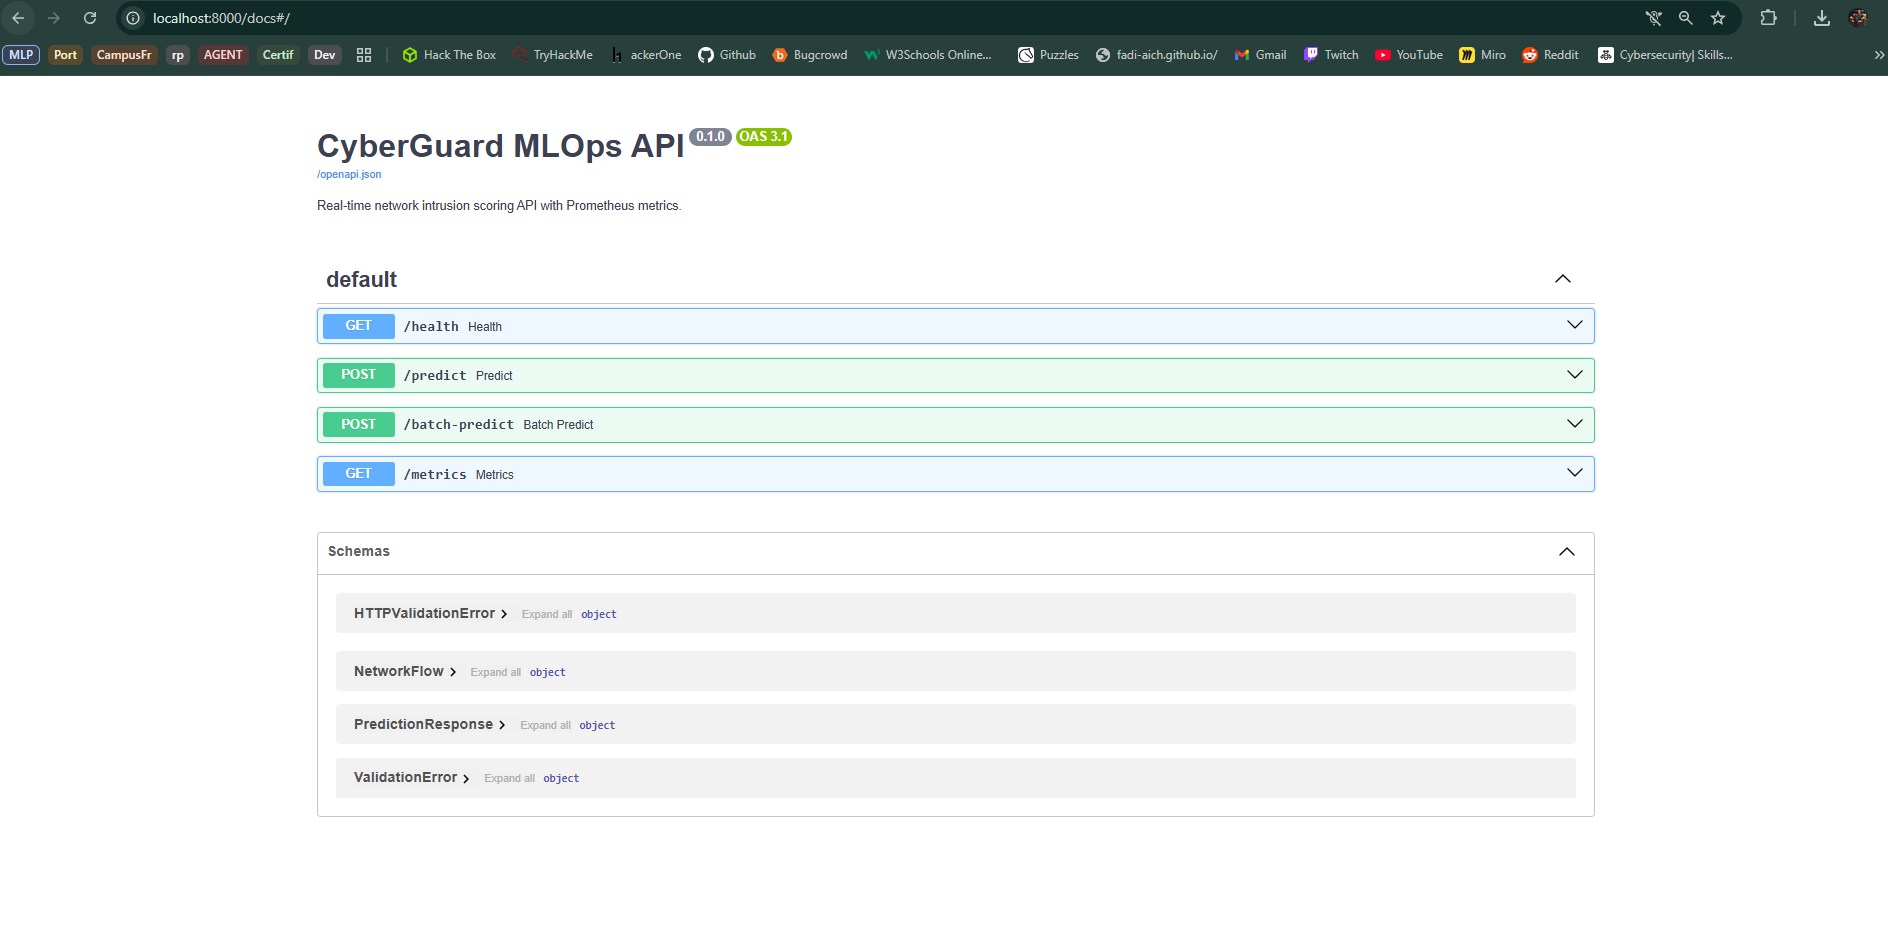
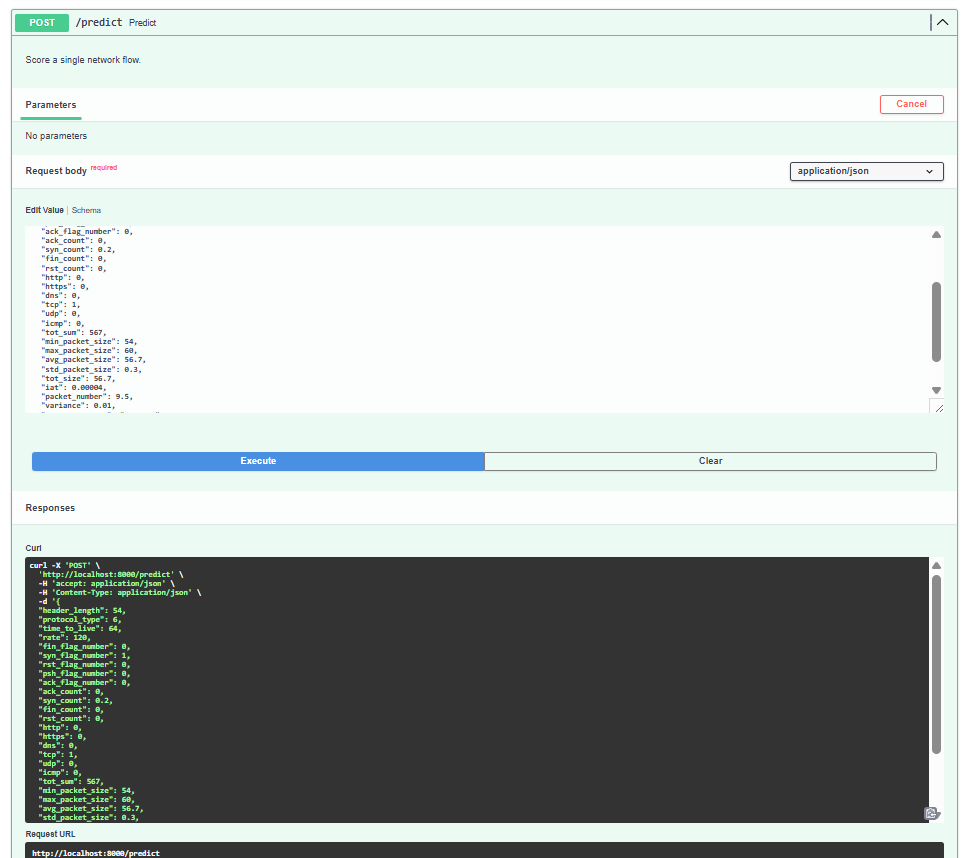
The selected model is exposed through a FastAPI service. The API separates inference from the training code and provides a documented interface that other services can call.
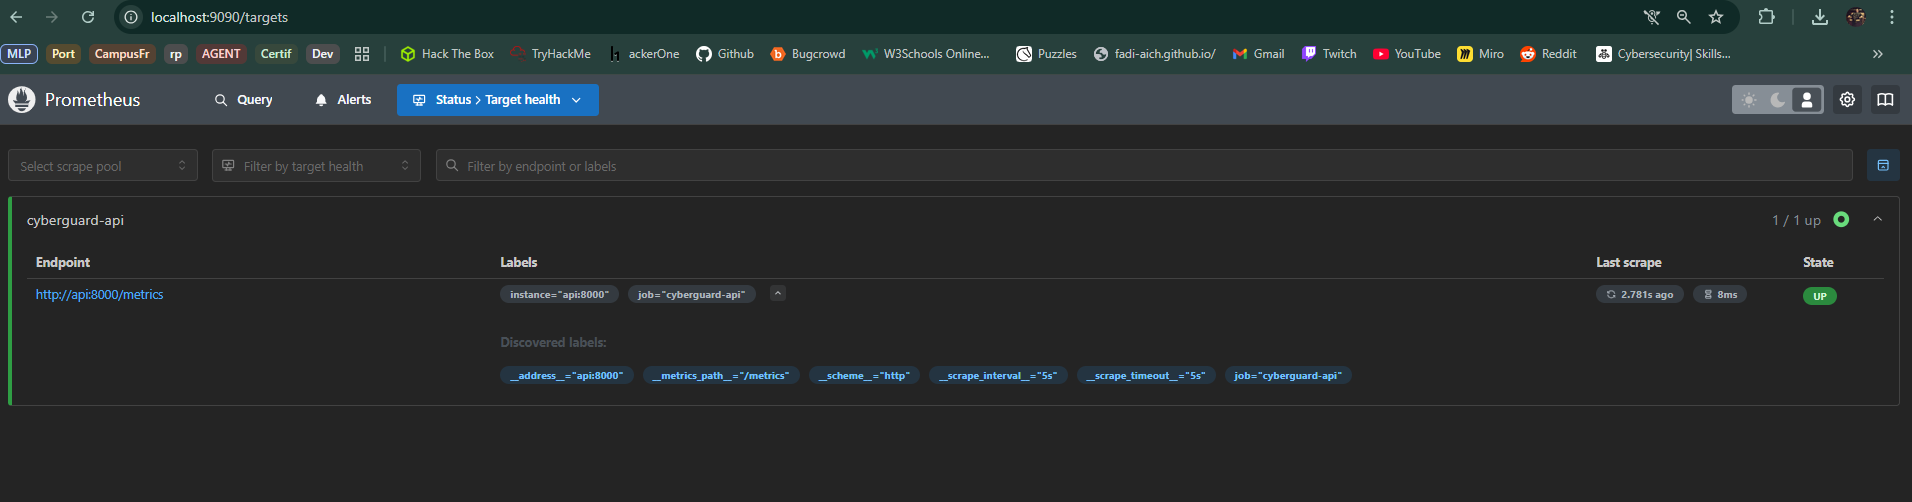
The serving layer also exports Prometheus metrics so inference is observable instead of becoming a black box. That allows the monitoring layer to track API and prediction behavior while the model is exercised by replayed traffic.
7. Containerized platform
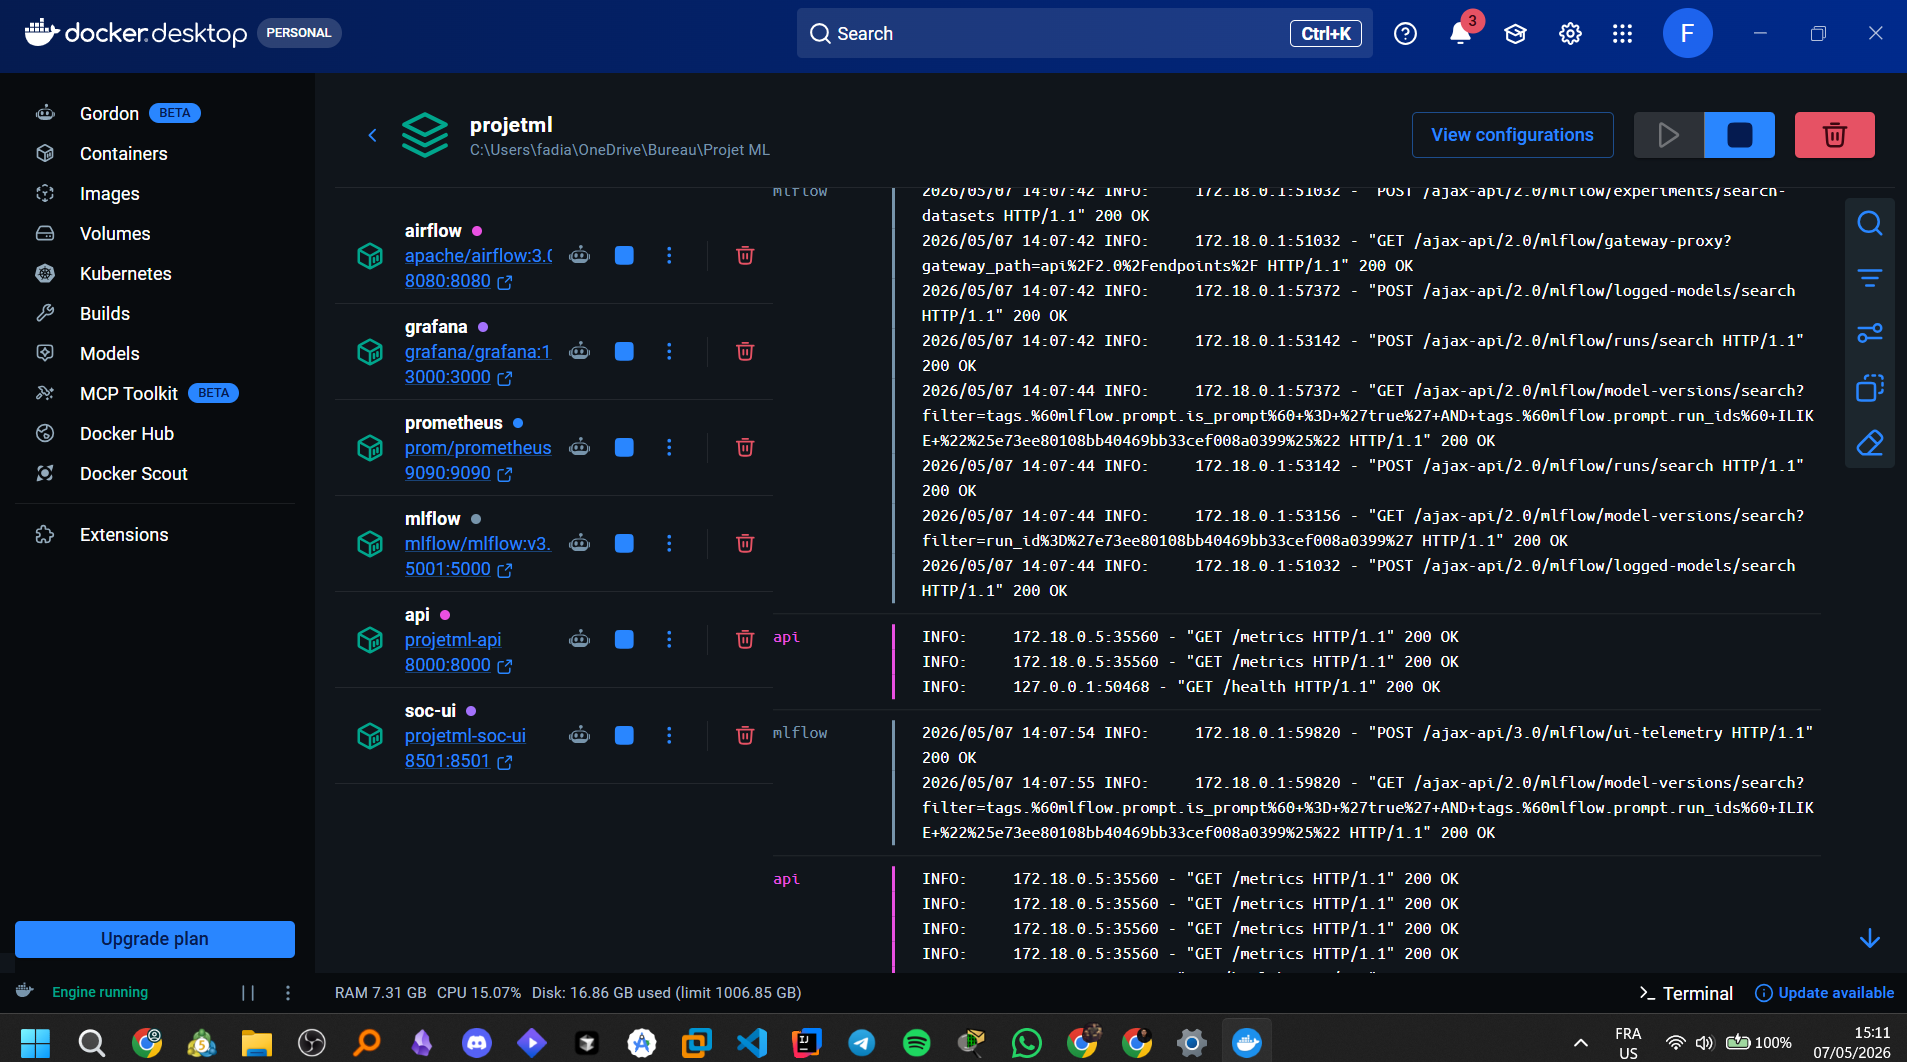
Docker Compose brings the project components together as one local platform. The stack includes MLflow, the FastAPI model service, Prometheus, Grafana, Airflow, the Streamlit SOC UI and a traffic-replay service.
This makes the project closer to a real system integration exercise: services have separate responsibilities and communicate through explicit interfaces rather than everything running inside one Python process.
8. Prometheus and Grafana monitoring
Prometheus collects metrics from the serving layer. Grafana turns those metrics and security-enrichment signals into a SOC-style dashboard with operational and analyst-oriented views.
The dashboard includes signals such as attack ratio, latency, source-country enrichment, severity and server-flow views. These contextual fields are used for monitoring and triage; the project explicitly does not use country, source IP, destination server or severity as model-training features.
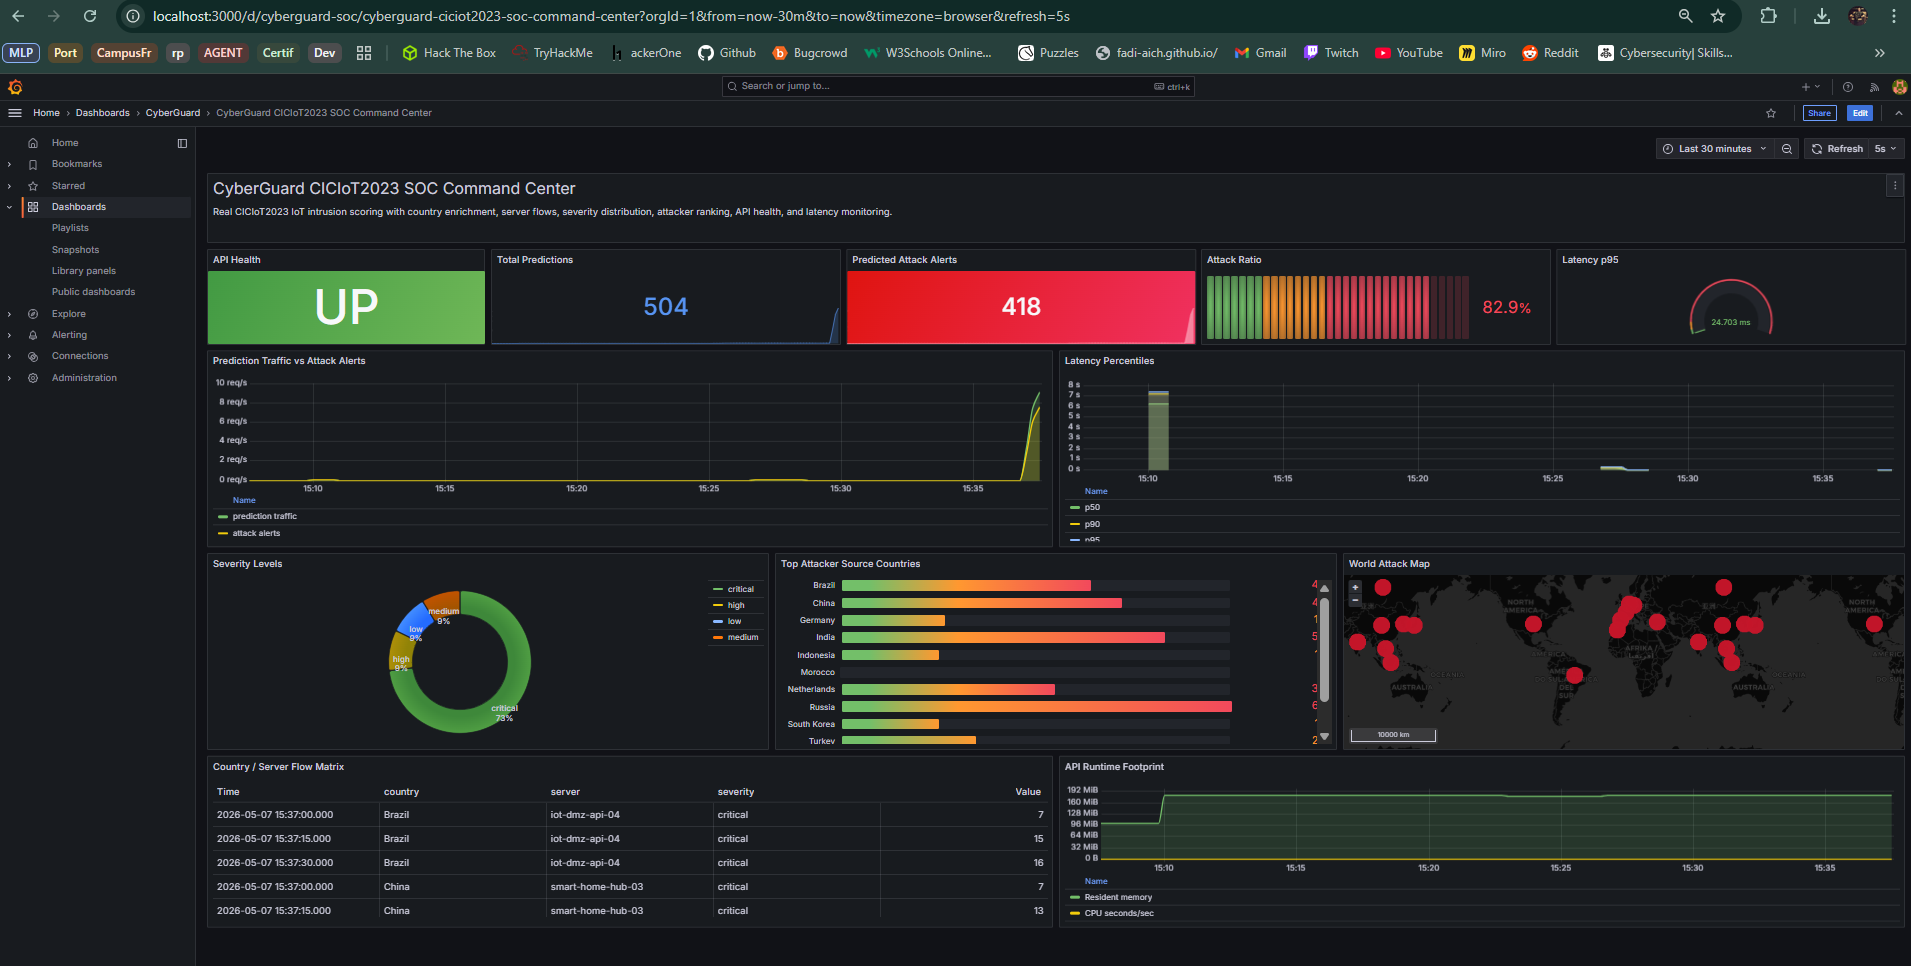
A traffic-replay service periodically sends CICIoT2023 rows to the API. This gives the monitoring layer continuous activity during demonstrations instead of showing a static dashboard with manually fabricated values.
9. Drift and security reporting
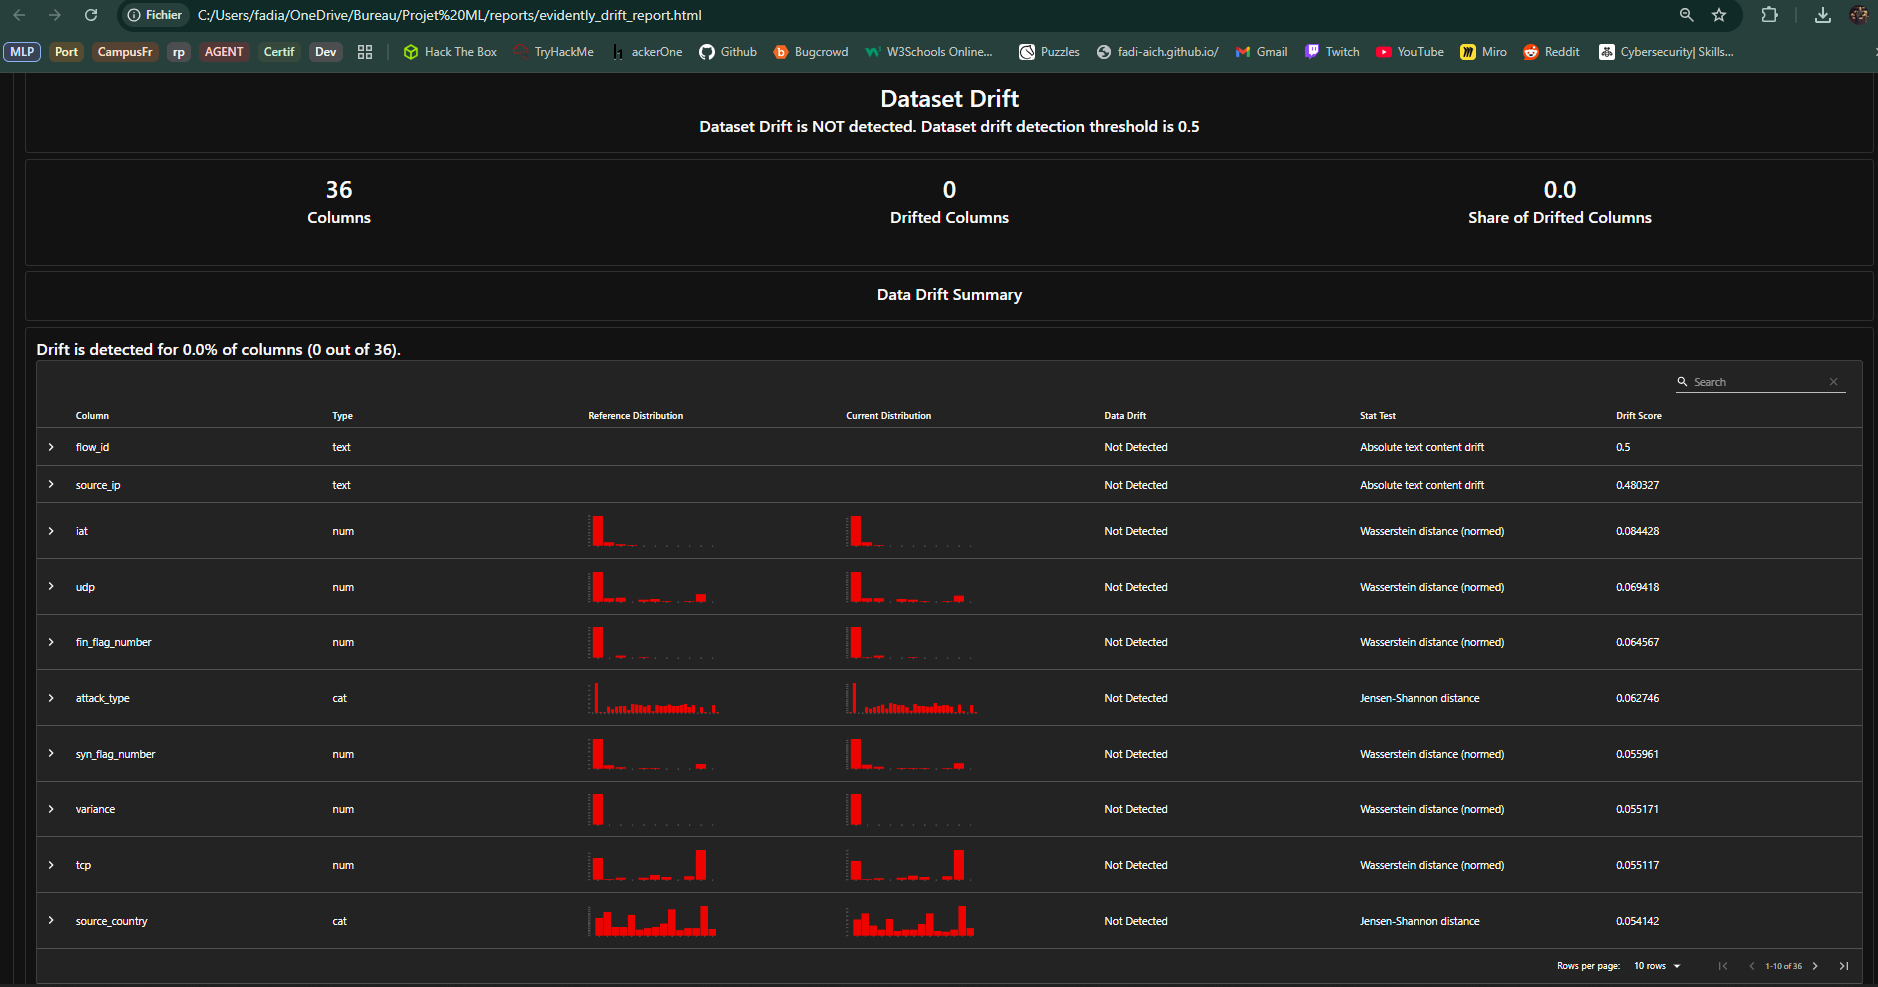
The project produces an Evidently drift report to inspect changes in the data presented to the system. Drift monitoring is important in security ML because the input distribution can evolve even when the application code remains unchanged.
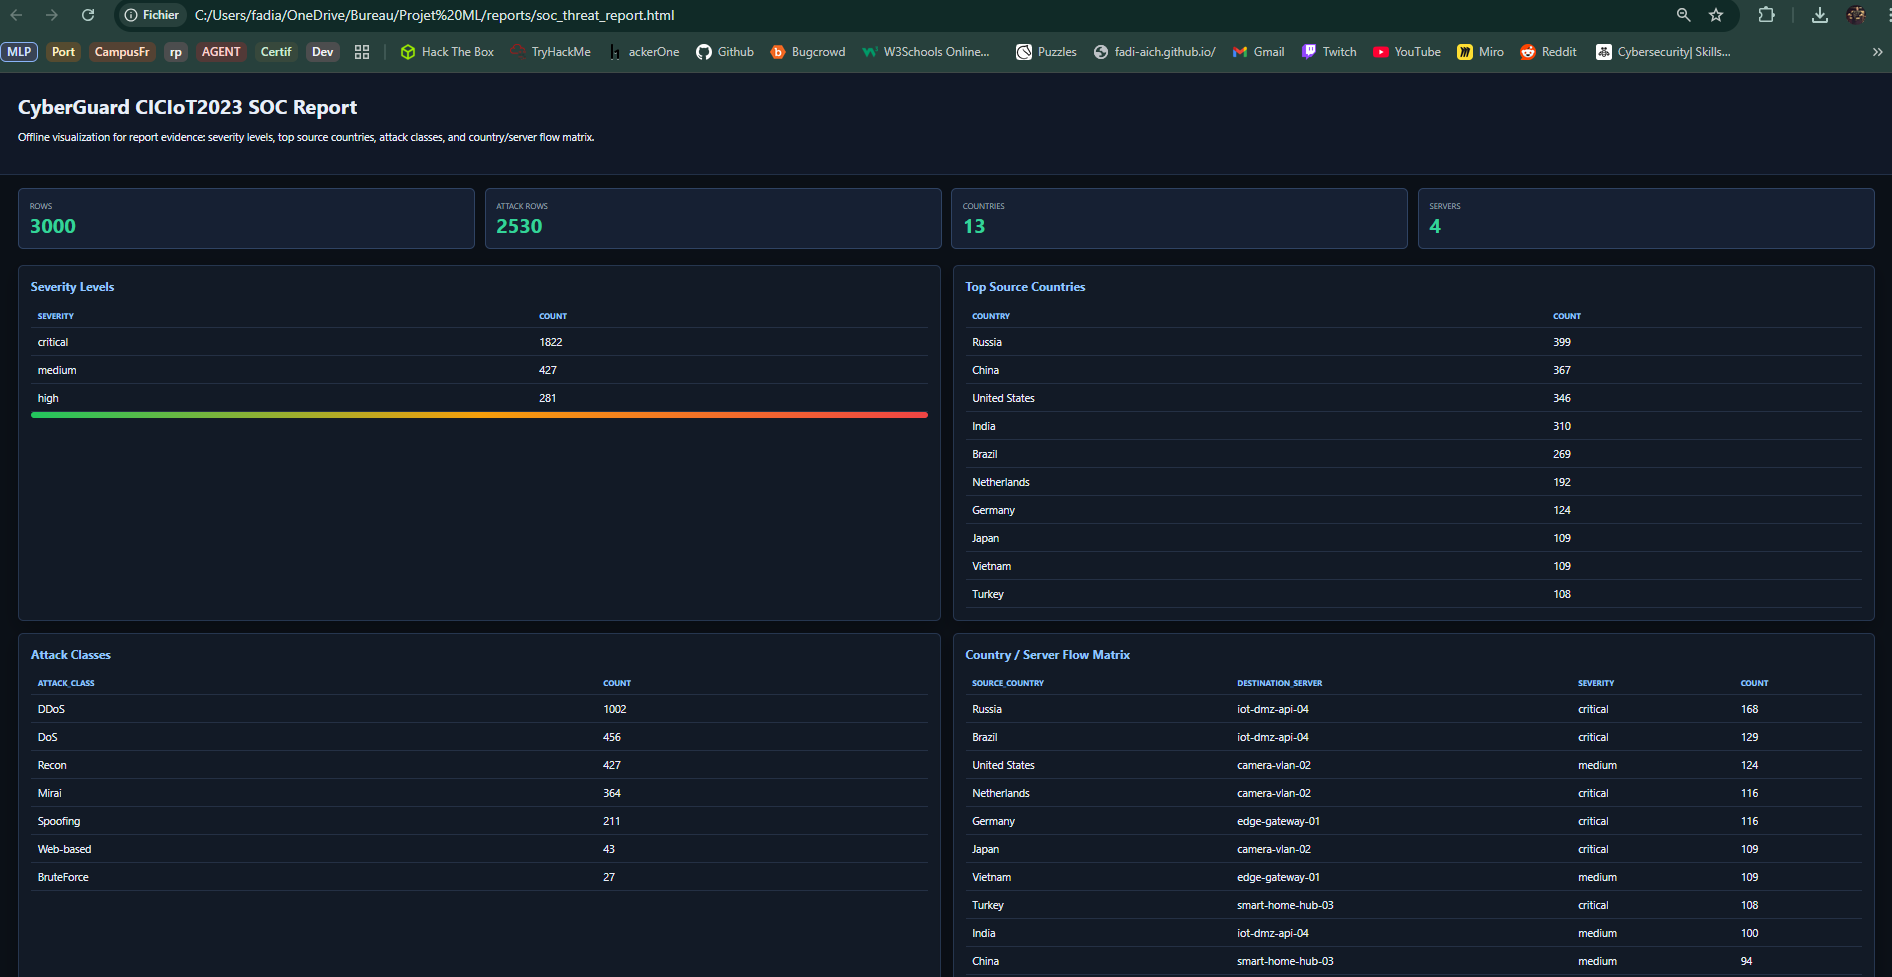
It also produces a SOC-oriented threat report so model output can be translated into information that is easier for an analyst to review.
10. Airflow orchestration
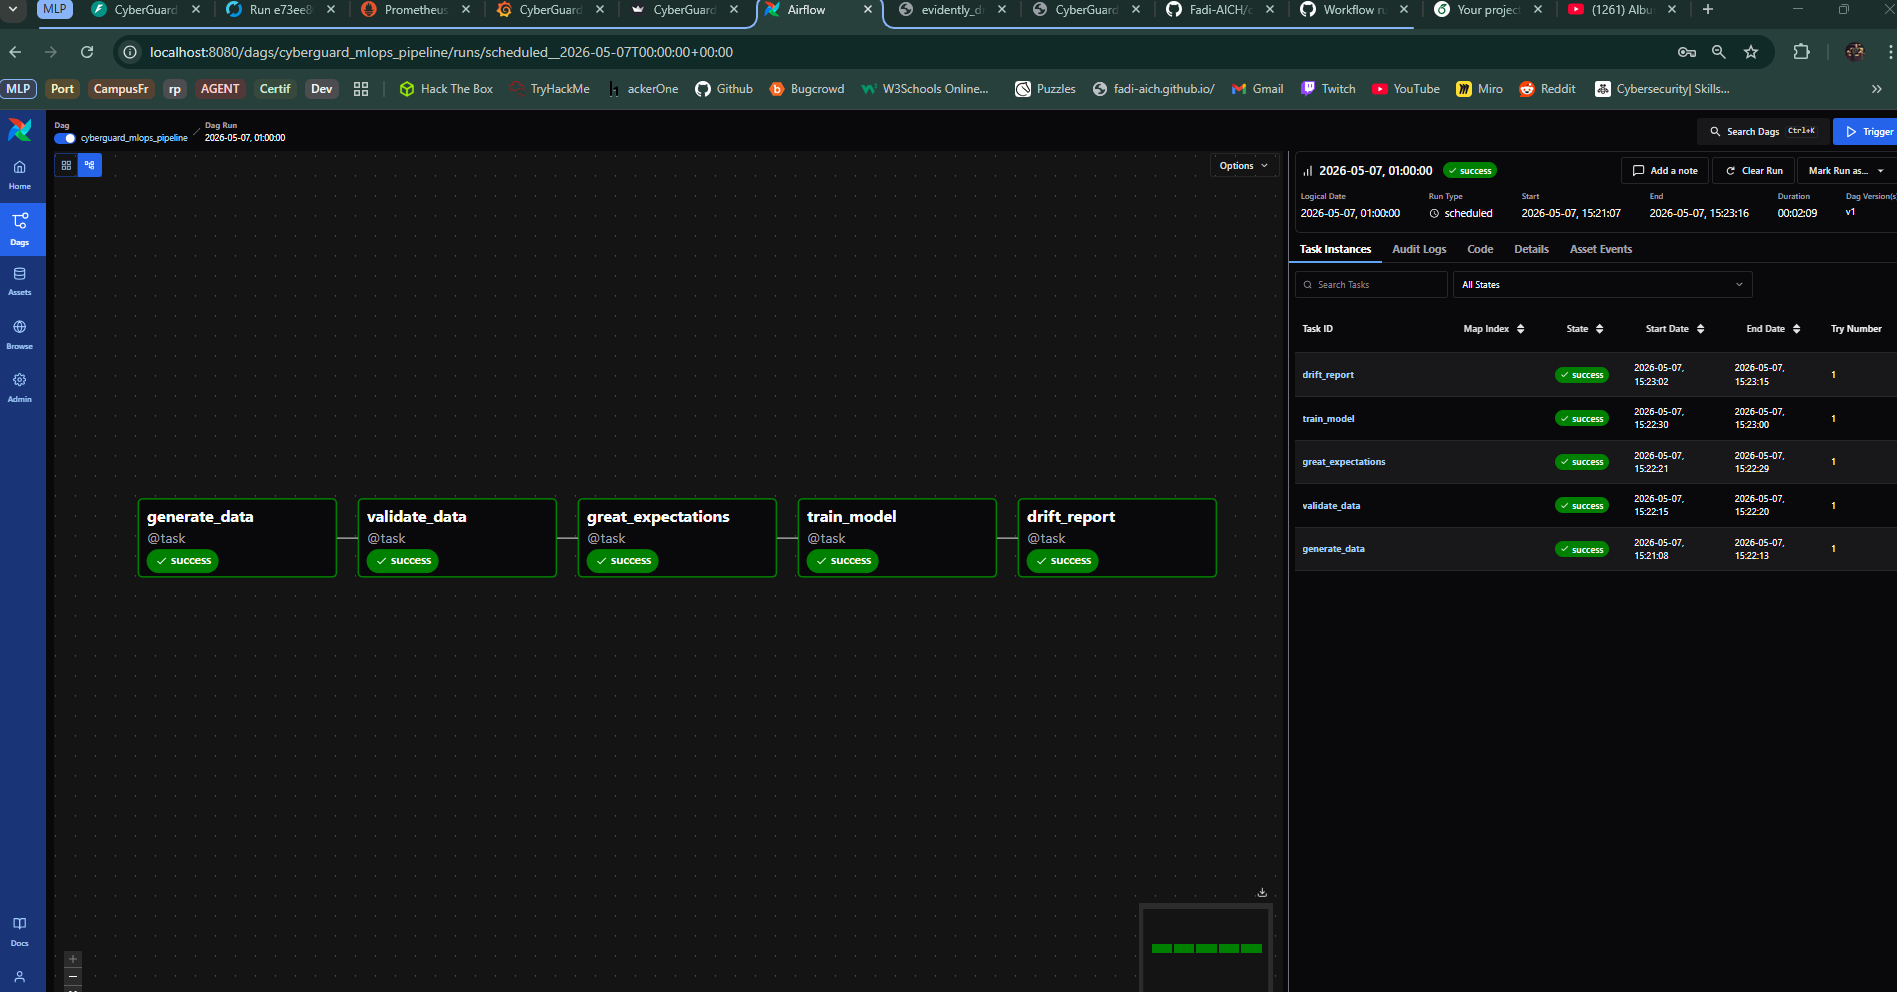
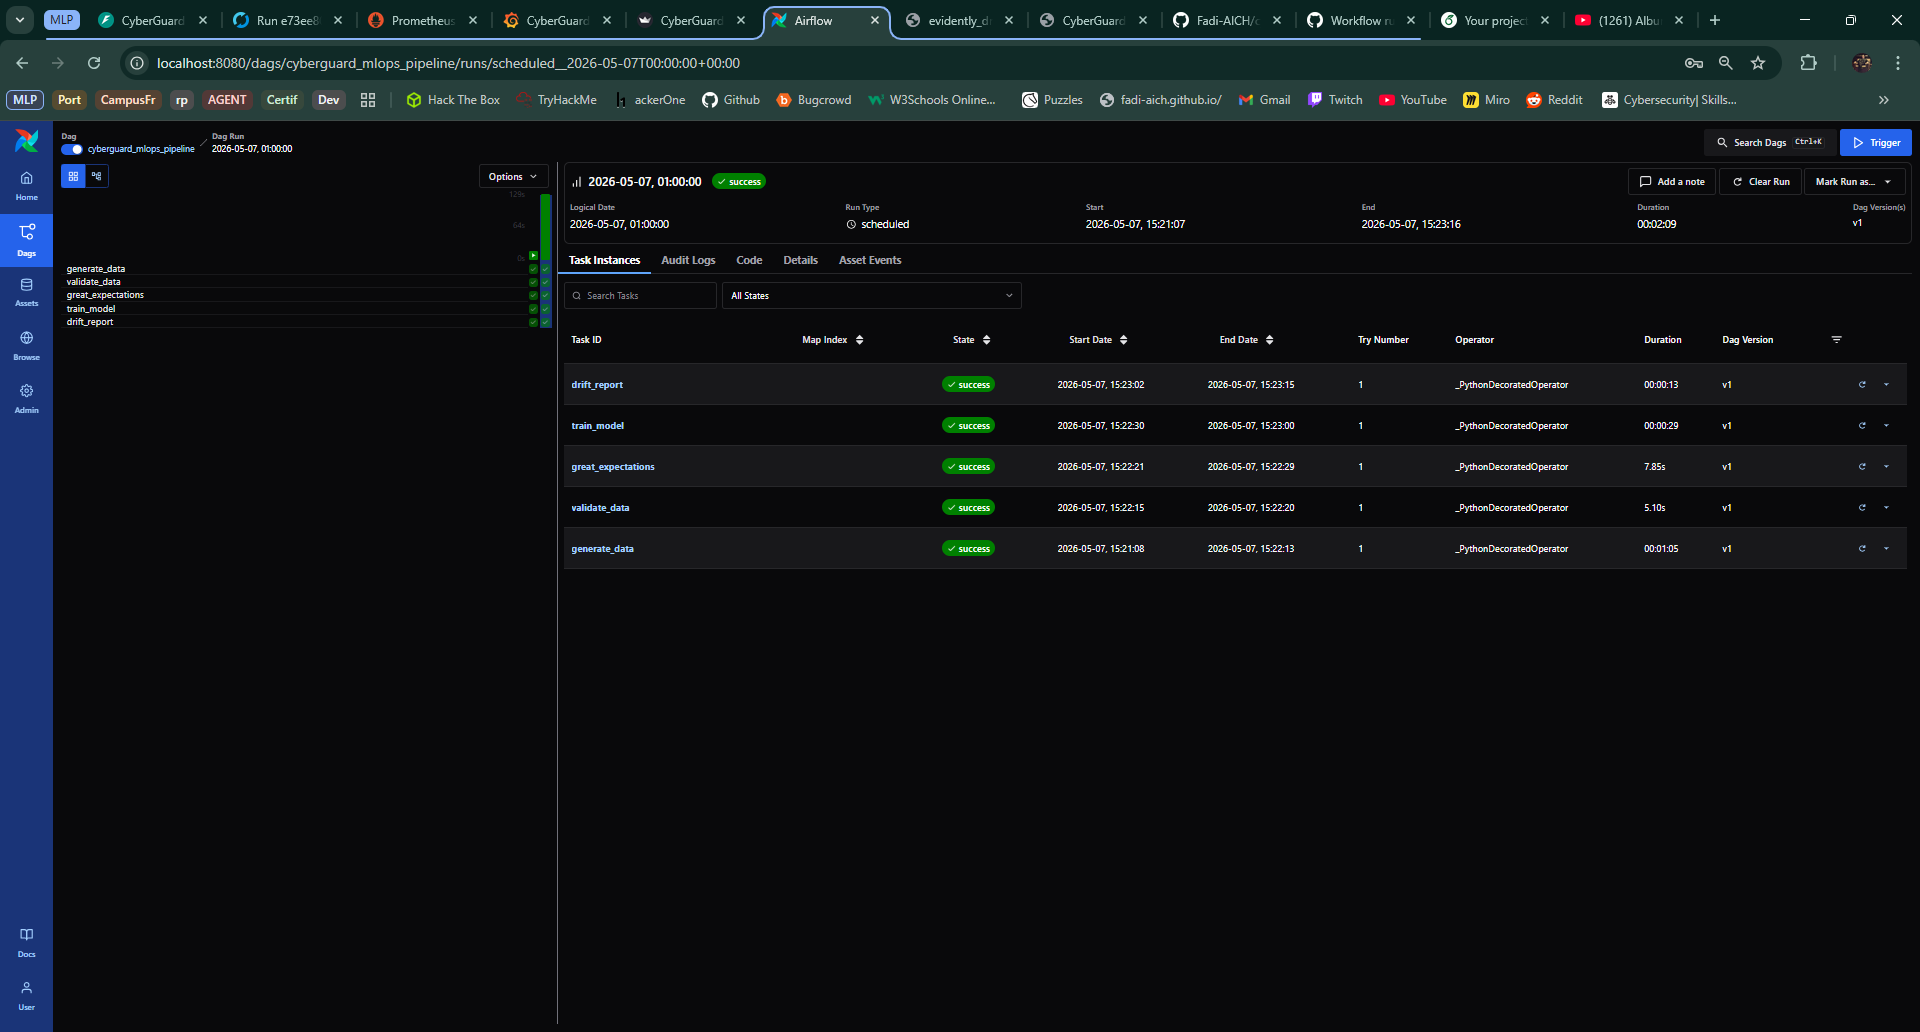
Airflow orchestrates the multi-stage workflow. This separates scheduling and dependency management from the individual Python components and makes the pipeline state visible through a DAG rather than hidden in a long shell script.
11. SOC analyst workbench
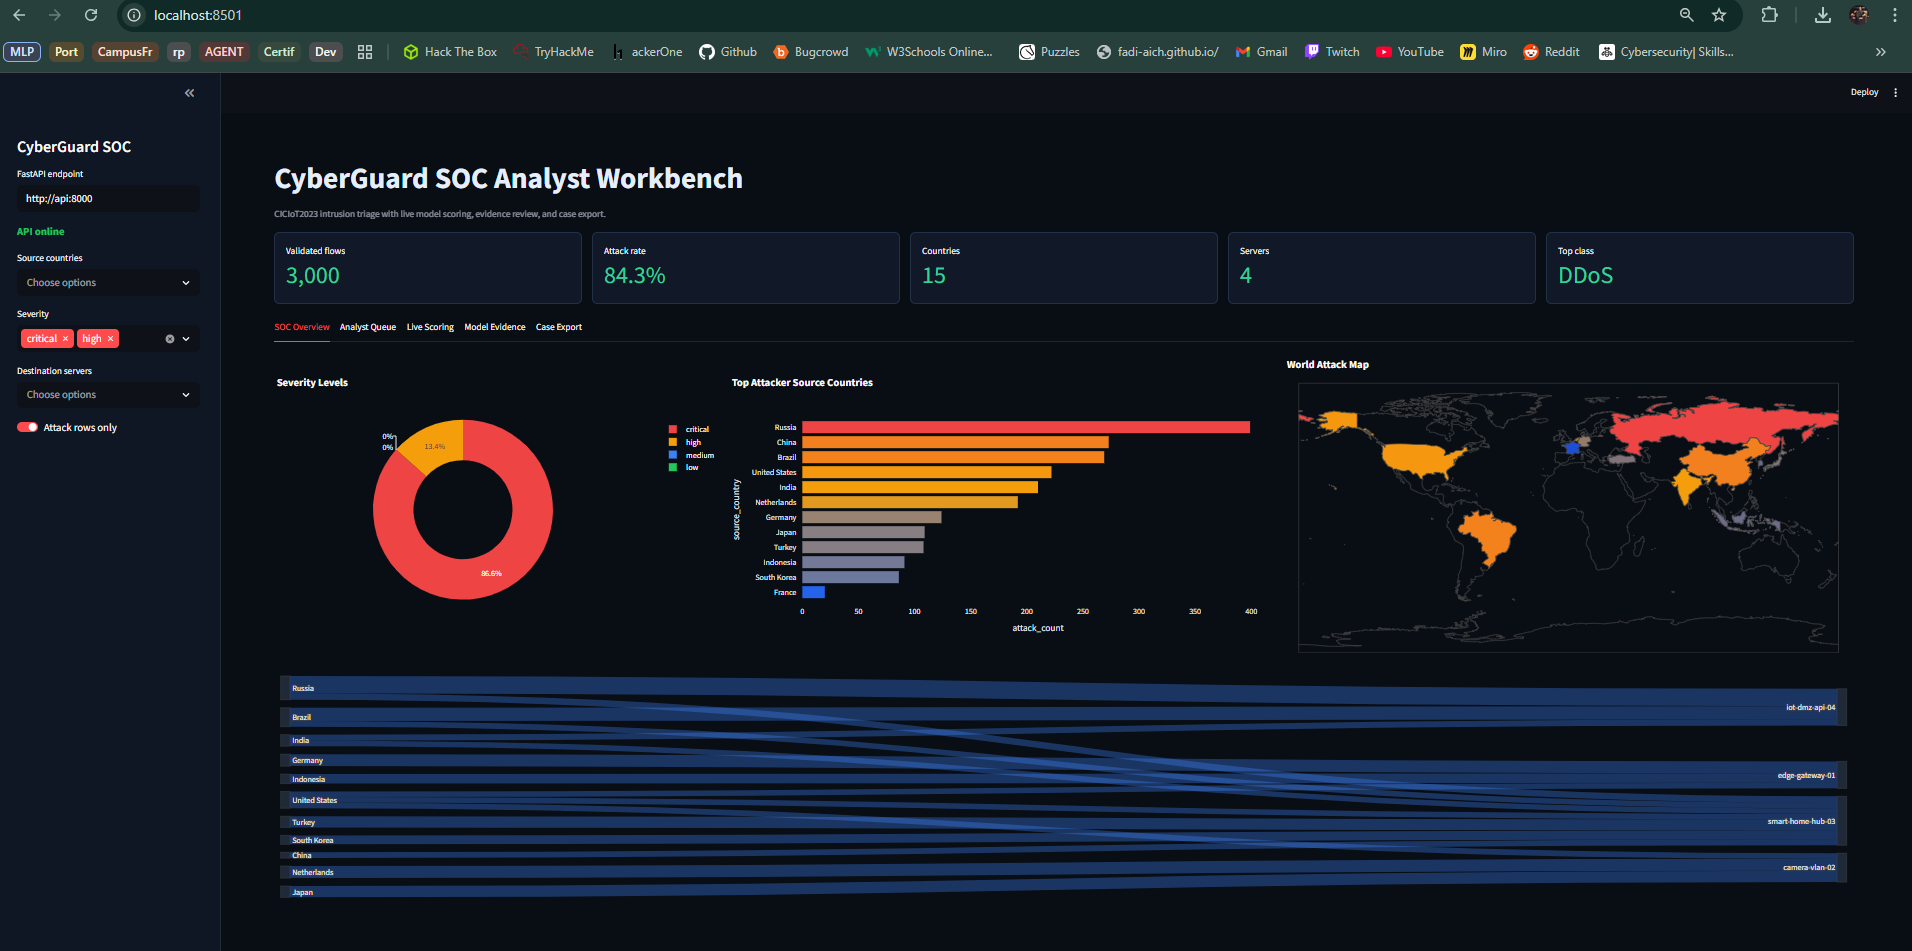
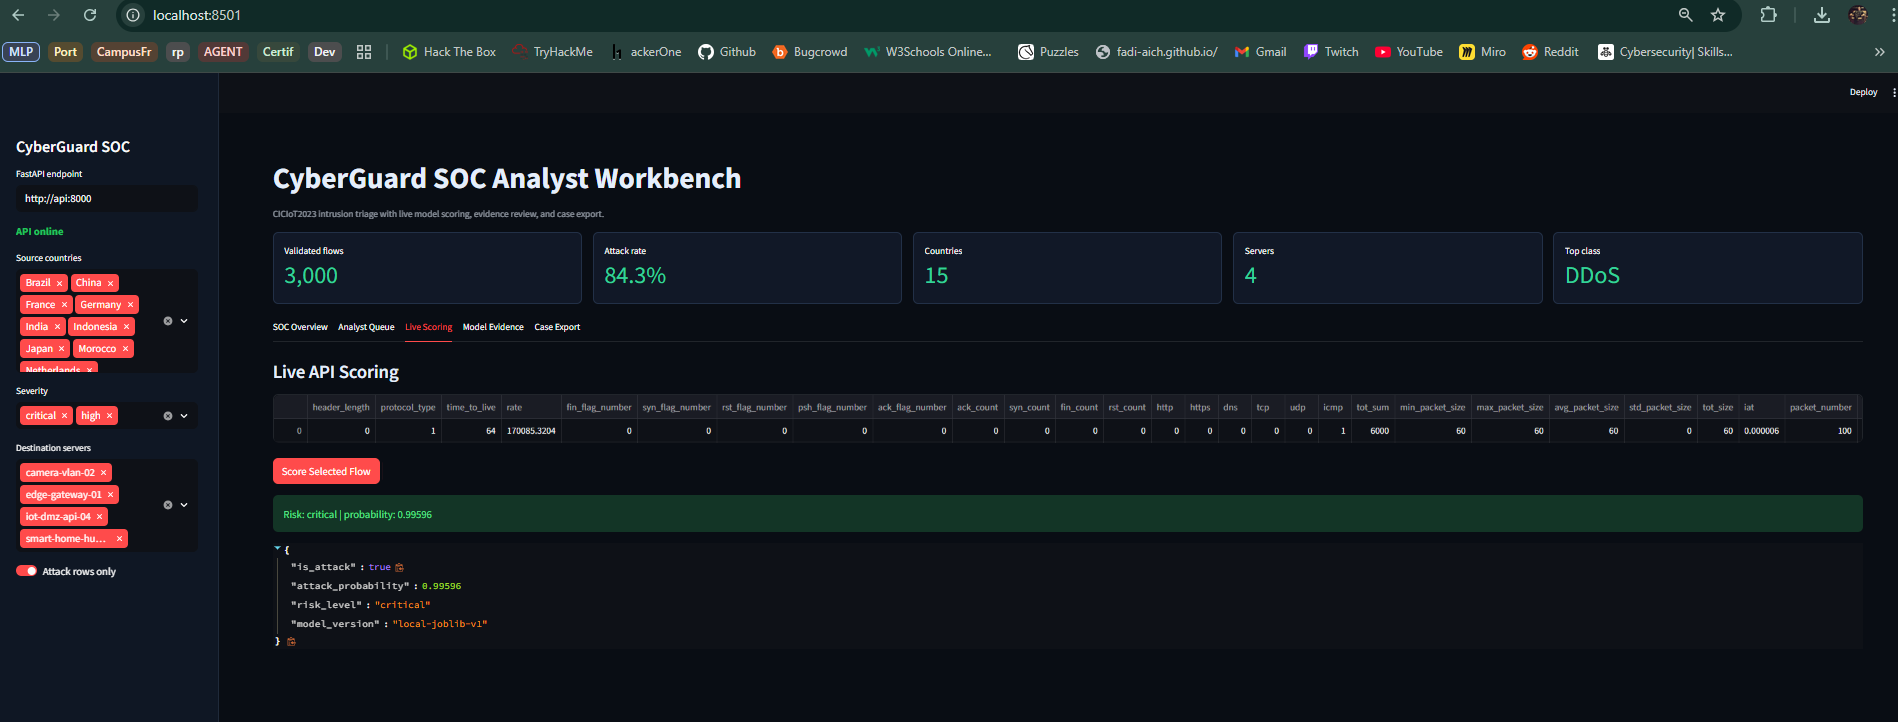
The Streamlit application is deliberately separate from Grafana. Grafana is useful for monitoring and operational dashboards; Streamlit is used as an analyst workbench for triage, live scoring, model evidence and incident-note export.
12. Code quality and CI/CD
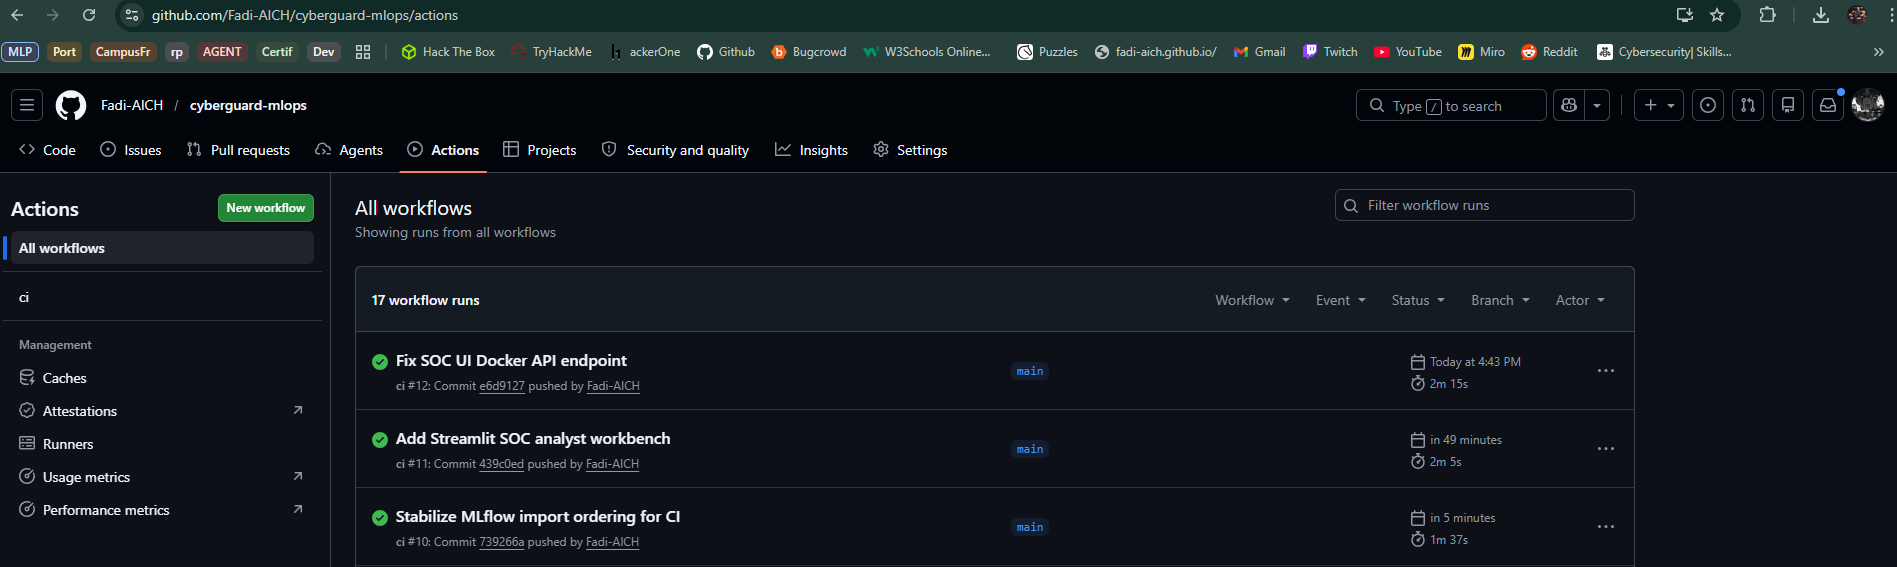
The repository includes automated checks rather than relying on manual testing before a commit. The documented quality pipeline covers:
pytestfor tests;- Black formatting checks;
- isort import ordering;
- Ruff linting;
- mypy type checking;
- Docker build validation through GitHub Actions.
13. What this project demonstrates
CyberGuard brings several engineering disciplines together:
- reproducible data and model workflows;
- data-quality checks;
- supervised model comparison;
- experiment tracking and model registry;
- API-based model serving;
- metrics and dashboard monitoring;
- drift reporting;
- containerized multi-service deployment;
- workflow orchestration;
- analyst-facing security tooling;
- automated code-quality checks.
14. Limitations
A production version would need a much larger and continuously refreshed dataset, production feature contracts, authentication and authorization around services, managed secrets, stronger model-governance controls, persistent infrastructure, longer-term drift baselines and a defined analyst feedback loop.