Tanger Med — Network Security Monitoring
During my cybersecurity and network-monitoring internship at Tanger Med Port Authority (TMPA), I worked on a passive Network Security Monitoring architecture designed to increase visibility over critical traffic without introducing risk to production. The project combined Cisco traffic mirroring and segmentation with a SELKS sensor running Suricata, Zeek, Elasticsearch/Kibana and Scirius.
1. What the project needed to achieve
The objective was not only to deploy an IDS. The monitoring chain needed to provide a usable SOC workflow:
- capture selected north–south and east–west traffic;
- preserve production by using passive acquisition;
- combine signature-based and behavioral visibility;
- centralize the resulting events for investigation;
- provide rule governance and tuning;
- validate the architecture with controlled attack scenarios;
- monitor the health of the collection pipeline itself.
2. Target architecture
Traffic from critical zones is mirrored from the aggregation layer toward a dedicated NSM sensor. Suricata and Zeek process the mirrored traffic, events are indexed in Elasticsearch, and Kibana/Scirius give the SOC investigation and rule-management capabilities.
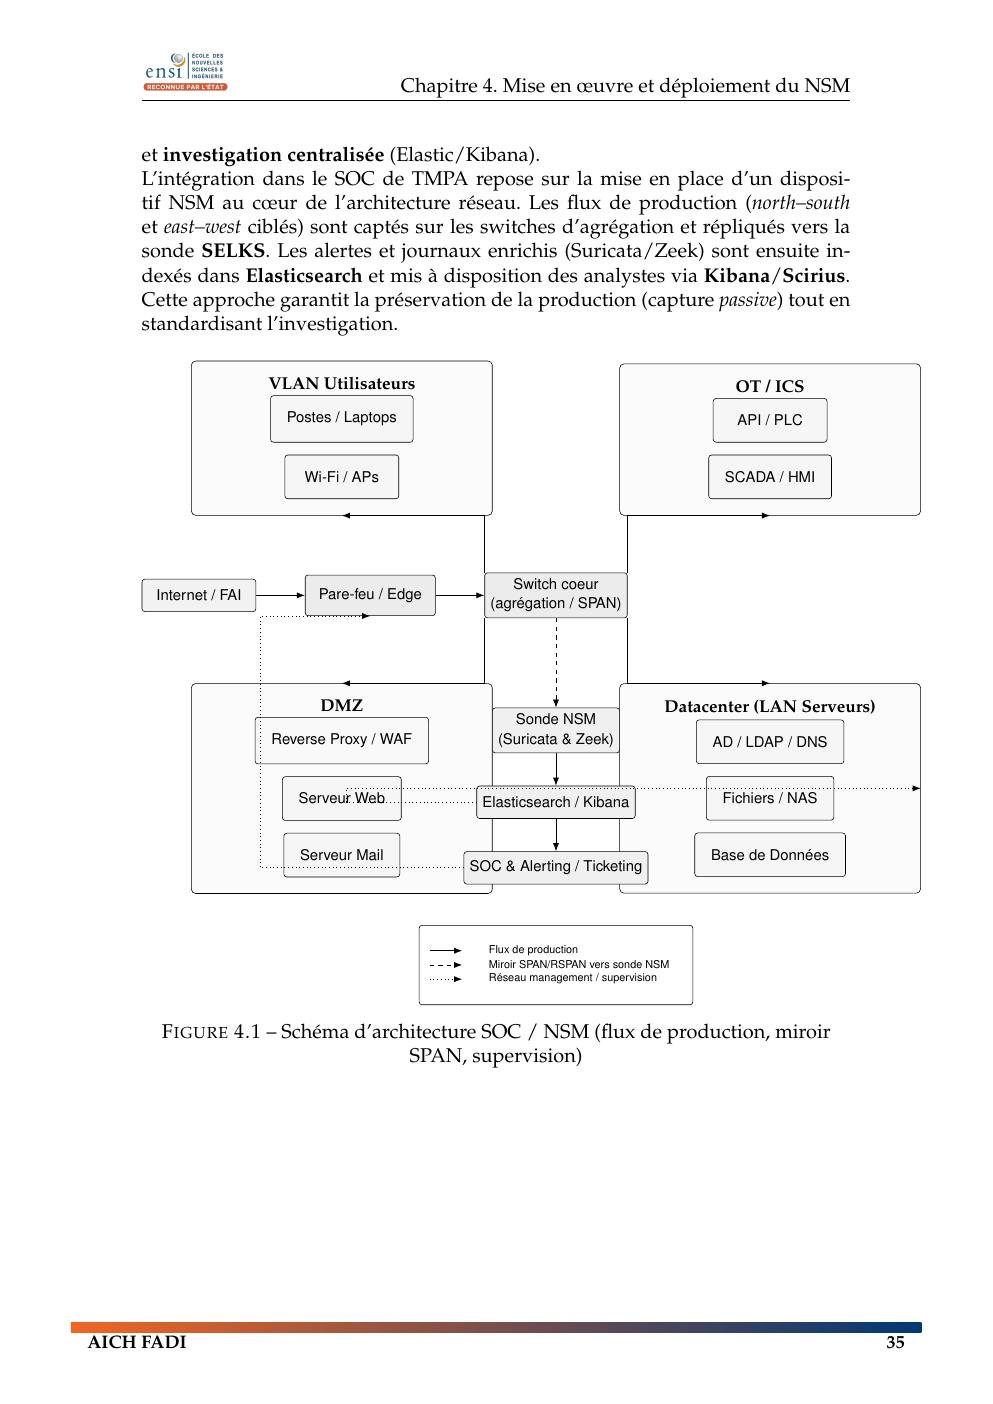
The architecture separates three concerns:
- Acquisition — Cisco SPAN/RSPAN delivers representative copies of traffic.
- Detection and telemetry — Suricata performs signature detection while Zeek produces protocol-oriented behavioral logs.
- Investigation and governance — Elasticsearch/Kibana centralize search and visualization; Scirius manages Suricata rules.
3. Network segmentation and switch preparation
The switch configuration was treated as part of the security project, not as a separate networking exercise. A Catalyst 2960 was reset to a known baseline before configuring the monitoring environment.
The design included:
- VLAN 10 — Production;
- VLAN 20 — Test;
- VLAN 30 — DMZ;
- VLAN 99 — Management;
- primary, isolated and community PVLANs for stronger DMZ isolation;
- SSHv2 administration;
- management reachability through a dedicated SVI;
- trunks carrying the required production, DMZ, management and PVLAN segments.
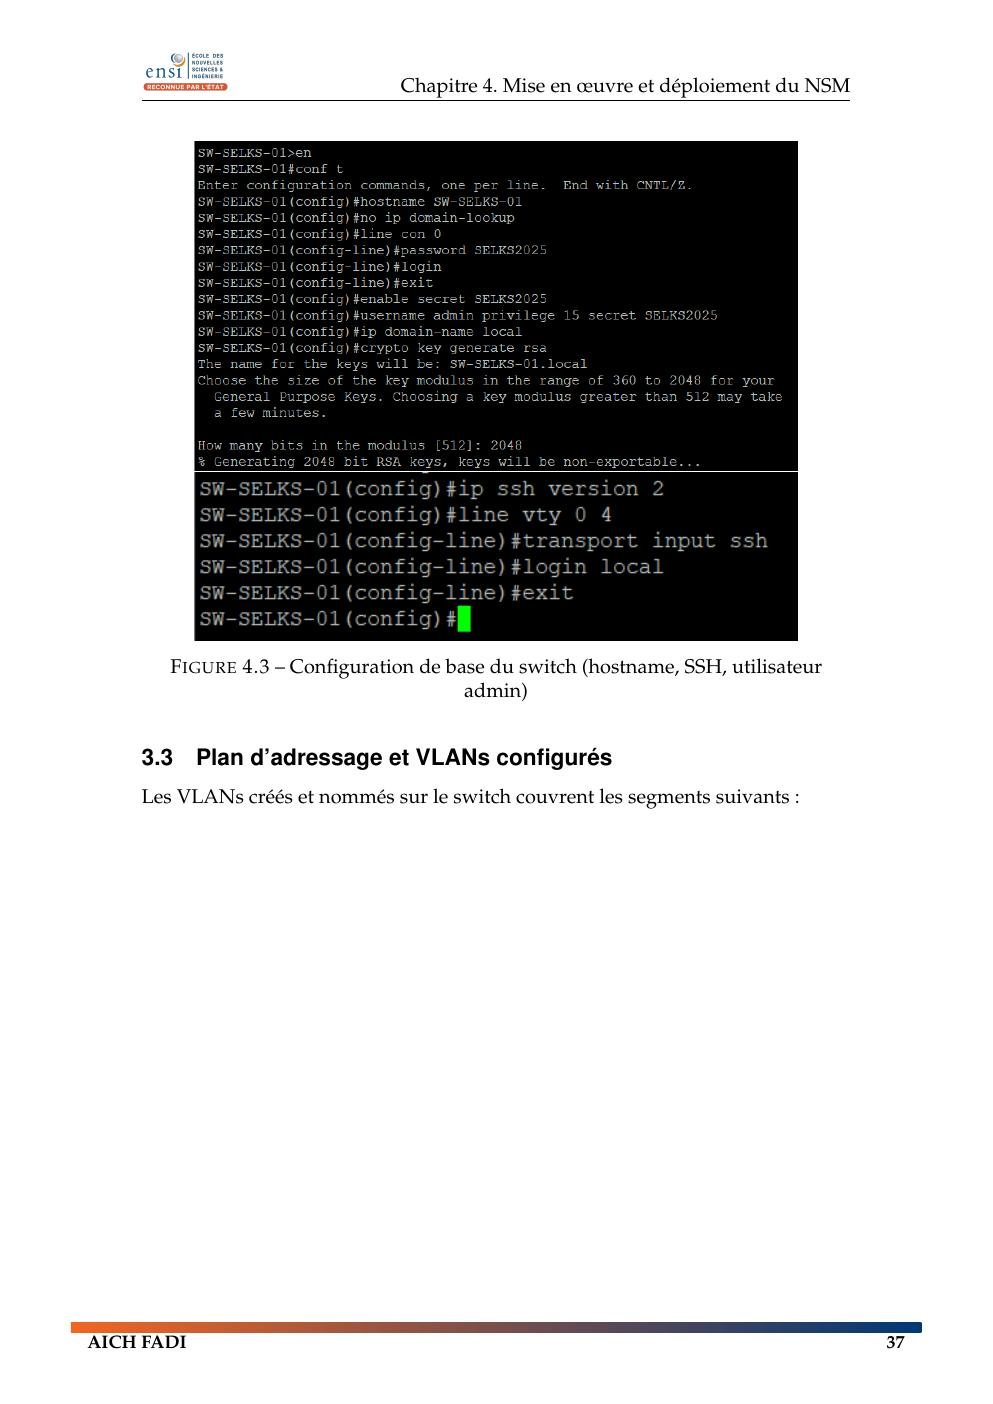
The management plane used VLAN 99 with an SVI at 192.168.99.2/24, and access to the switch was constrained through SSH and management ACL logic.
4. SPAN mirroring and why it mattered
The central acquisition decision was to use a dedicated SPAN session:
- Source interfaces:
Fa0/1throughFa0/14covering targeted production and DMZ systems. - Destination interface:
Fa0/19, connected to the SELKS capture interface. - Trunks:
Fa0/22–24transported the required VLANs.
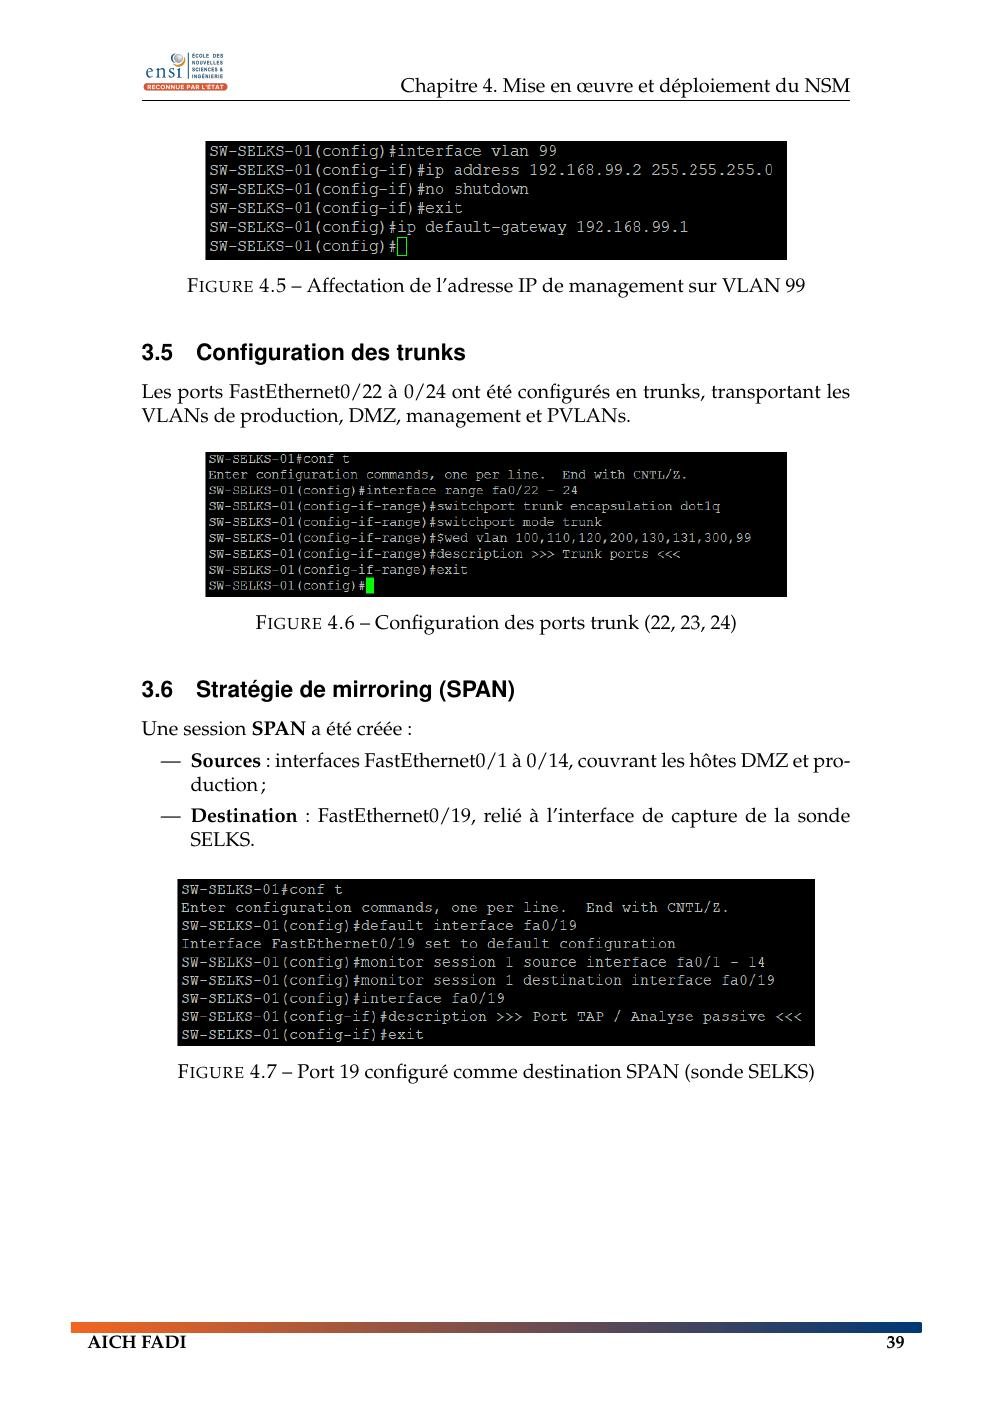
This design is safer than placing an experimental monitoring stack inline. If the sensor fails, production forwarding should remain unaffected.
5. PVLAN isolation in the DMZ
Private VLANs were used to reduce unnecessary lateral communication between systems in the DMZ. The report documents primary VLANs associated with isolated/community VLANs and a promiscuous path toward the firewall/router.
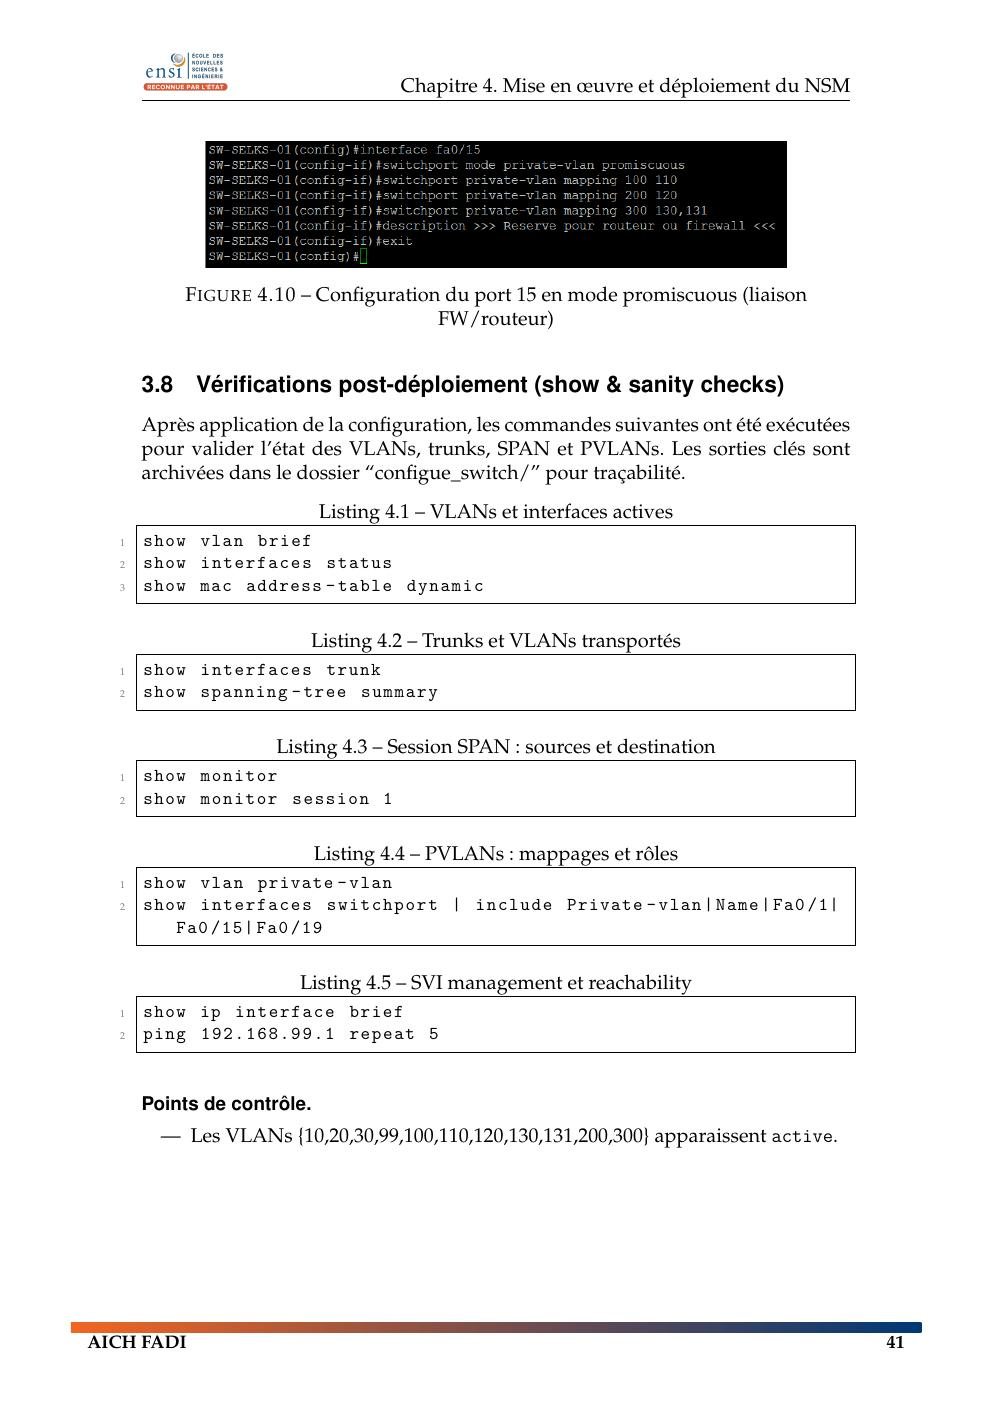
After configuration, I used standard Cisco verification commands to check VLAN state, trunks, SPAN sessions, PVLAN mappings and management reachability. The aim was to make the capture layer verifiable instead of assuming it worked because dashboards showed data.
6. SELKS sensor deployment
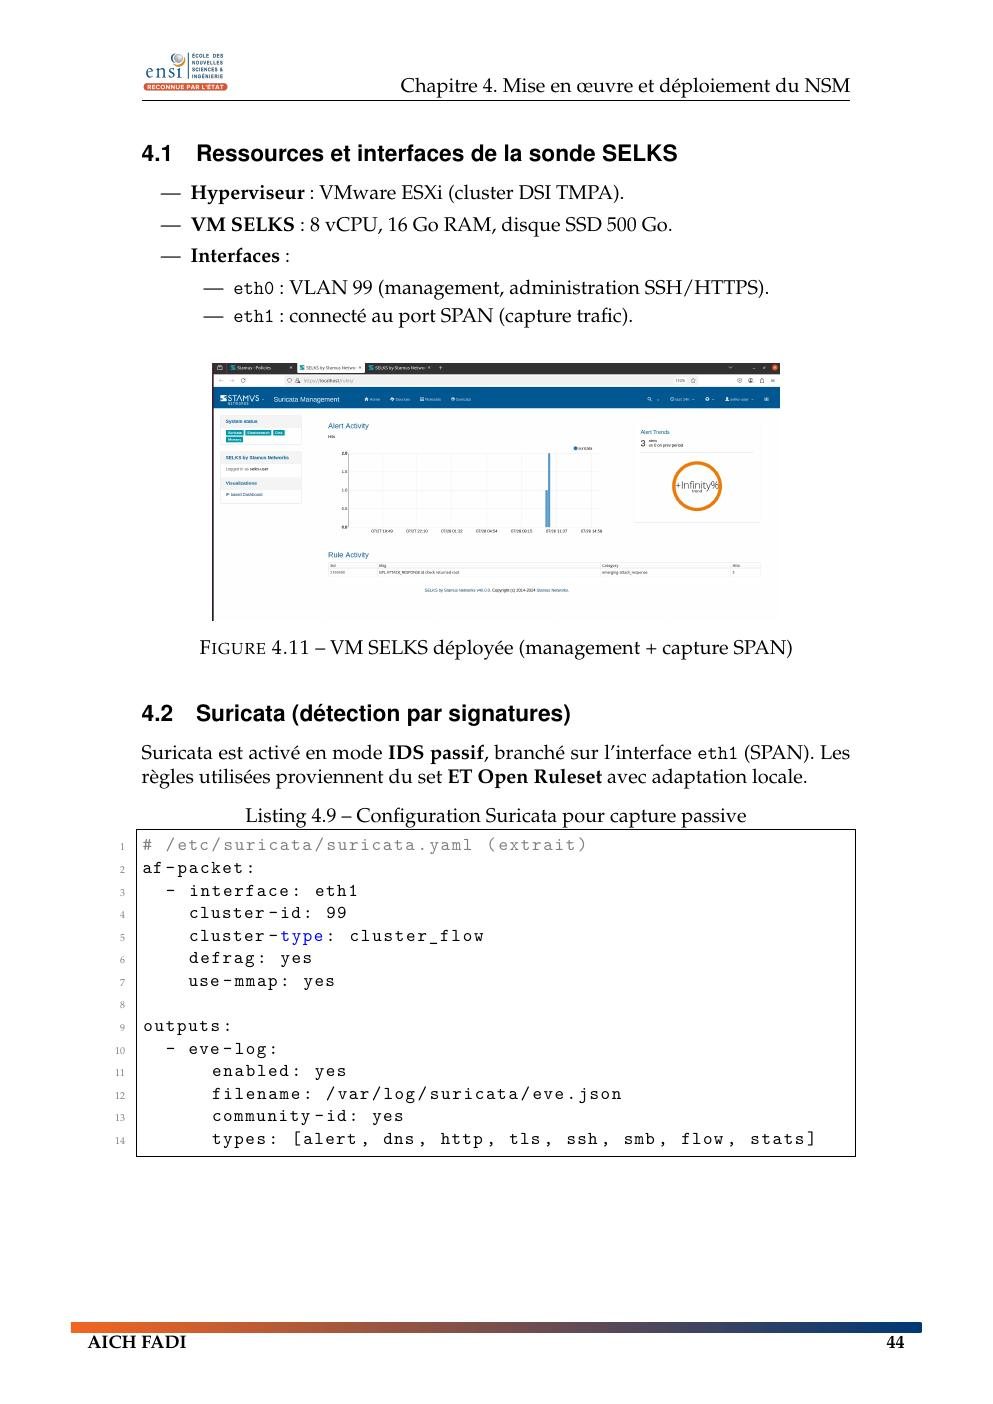
After network acquisition was ready, the SELKS sensor was deployed on a dedicated VM. The report specifies:
- 8 vCPU;
- 16 GB RAM;
- 500 GB SSD;
eth0for management on VLAN 99;eth1connected to the SPAN destination for traffic capture.
7. Suricata: signature-based detection
Suricata ran in passive IDS mode on the capture interface. The configuration used af-packet, memory-mapped capture and eve.json output so alerts and protocol events could be forwarded into the rest of the stack.
The output types included alert, DNS, HTTP, TLS, SSH, SMB, flow and statistics data. Rules came from ET Open with local tuning.
Suricata’s role in this architecture is to answer questions such as:
- Does the traffic match a known scan or attack signature?
- Is there a suspicious authentication or protocol pattern?
- Which source/destination pair generated the alert?
- How severe and frequent is that detection?
8. Zeek: behavioral and protocol context
Zeek complements Suricata. Instead of depending primarily on signatures, it produces detailed protocol logs such as conn.log, dns.log, http.log, ssl.log and files.log.
That makes it useful for behavior-oriented investigation: DNS anomalies, TLS fingerprints, unusual connection patterns, lateral movement indicators and exfiltration context.
9. Elasticsearch, Kibana and Scirius
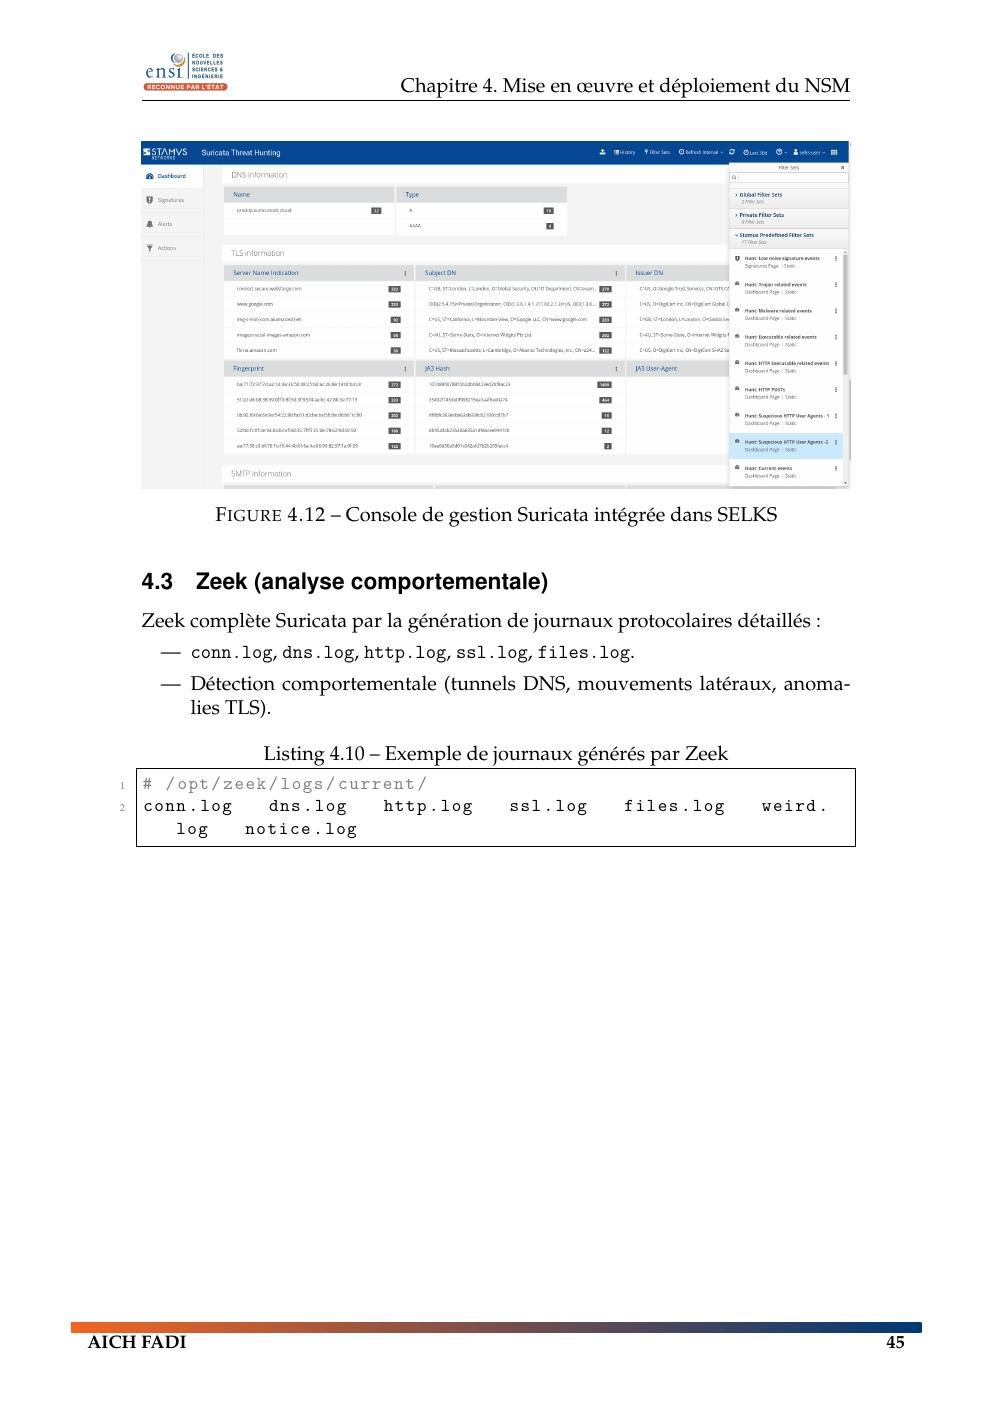
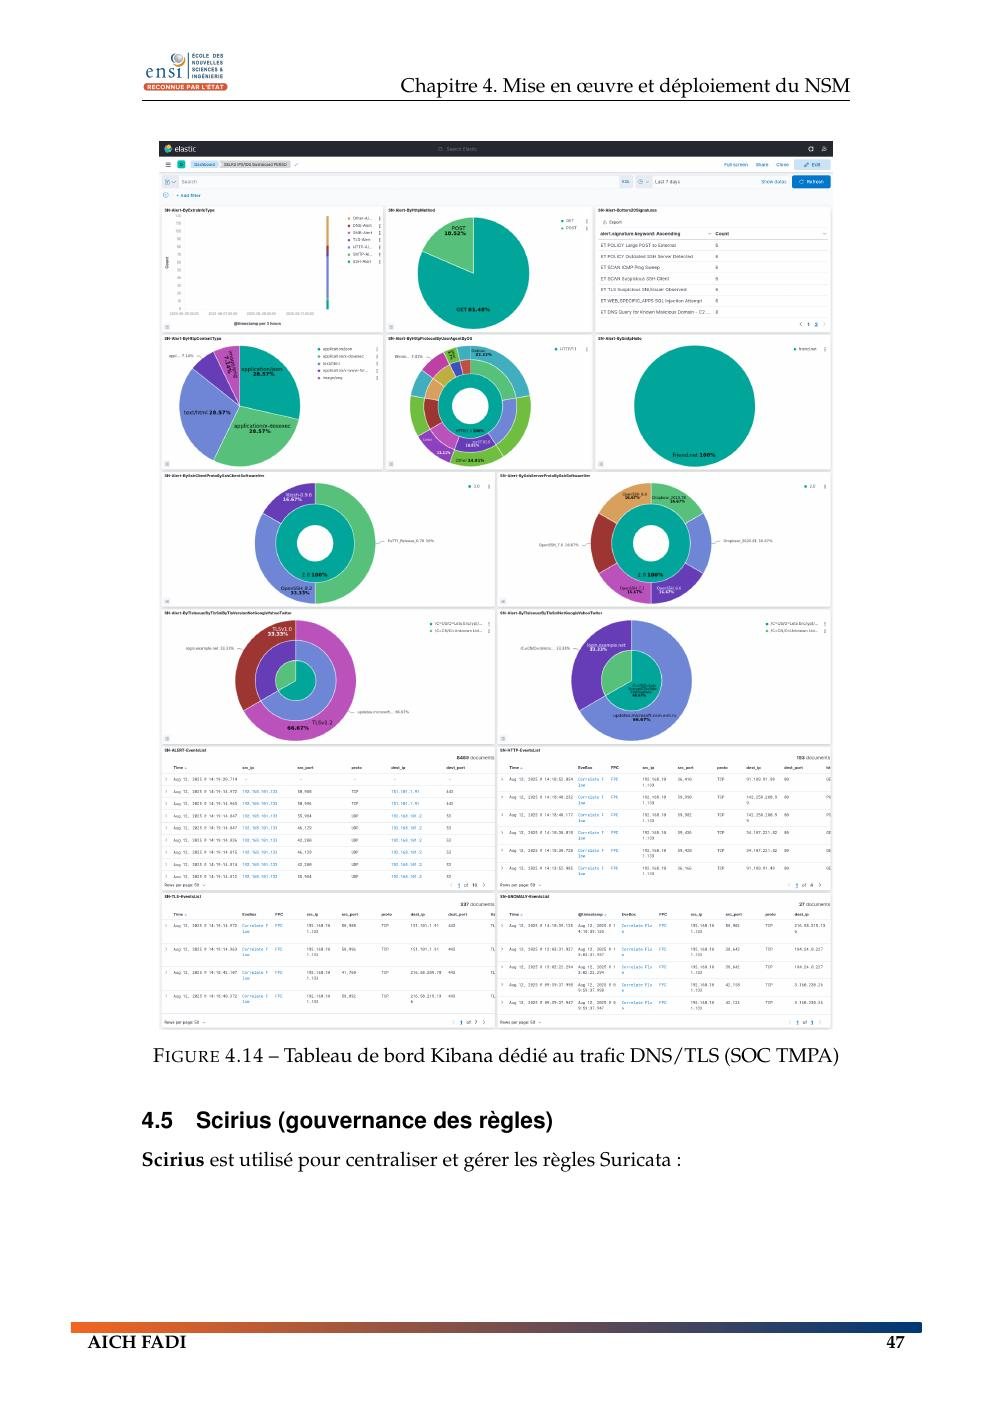
Events from Suricata and Zeek are indexed in Elasticsearch. Kibana is the investigation layer used for filtering, dashboards and alerting. The project includes views around DNS, TLS/JA3, HTTP and SSH activity.
Scirius is used to manage Suricata rules centrally: enabling/disabling signatures, updating rule sets and classifying detections by criticality. This becomes important once the sensor starts producing enough alerts that tuning is necessary.
10. Validation methodology
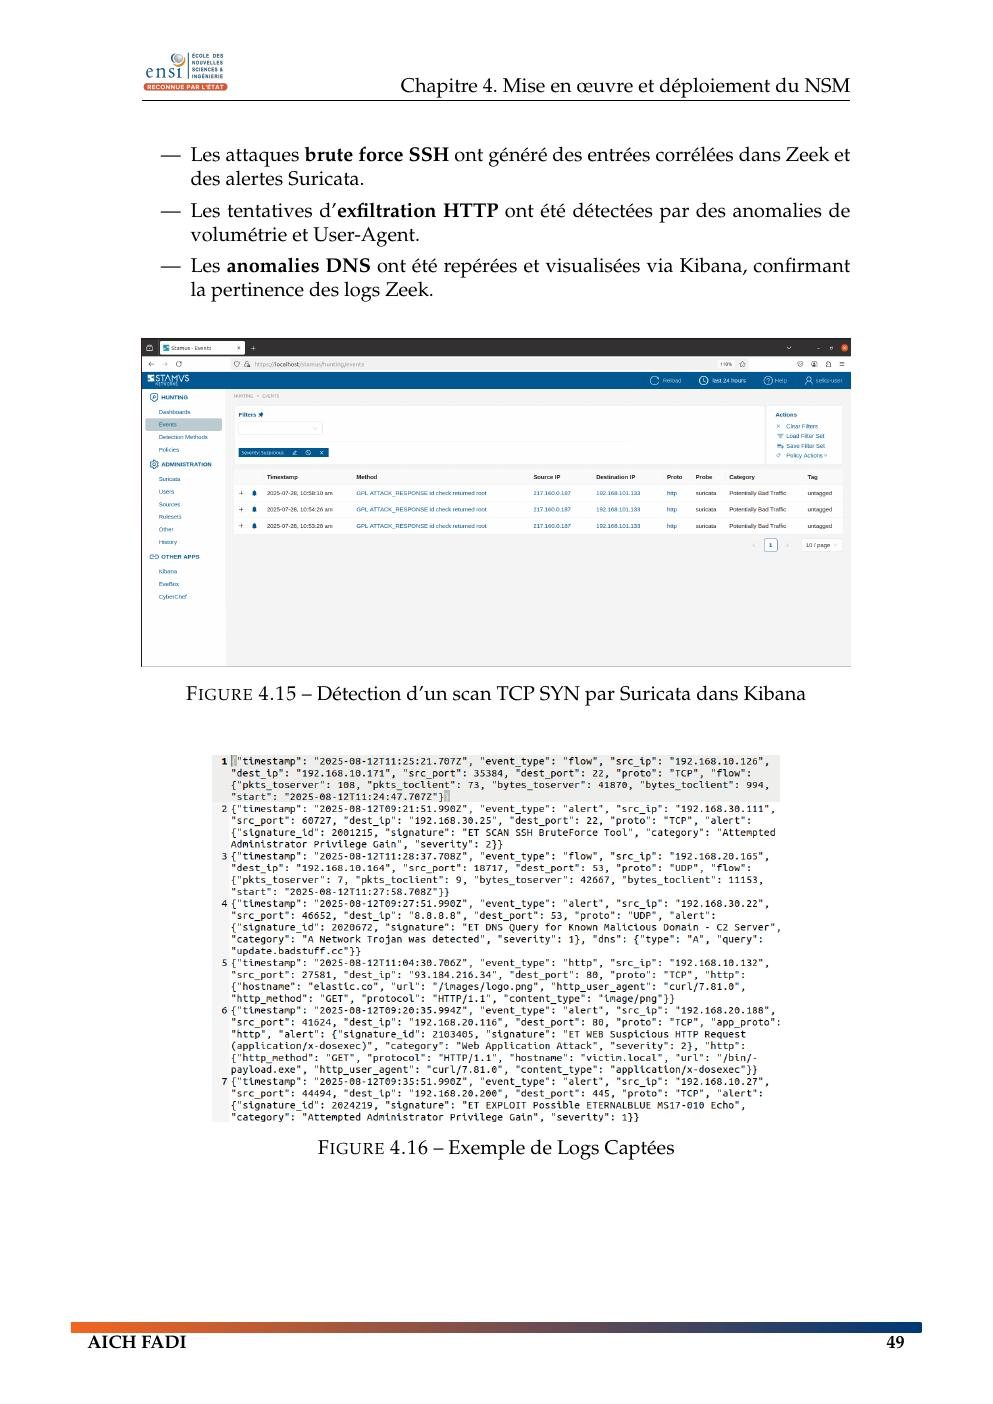
I did not validate the project only by checking that the services were running. The report describes a three-step method:
- 48-hour baselining to observe recurring normal traffic.
- Controlled attack simulation for common NSM scenarios.
- SOC verification to confirm that Suricata/Zeek evidence appears coherently in the investigation layer.
The validation matrix covered four scenarios:
| Scenario | Observable behavior | Expected evidence |
|---|---|---|
| TCP SYN scan | many incomplete connections across ports | Suricata ET SCAN + Zeek connection logs |
| SSH brute force | elevated authentication failures on port 22 | Suricata alert + authentication/connection context |
| HTTP exfiltration simulation | unusual outbound volume / suspicious User-Agent | Zeek HTTP evidence + Kibana volumetric analysis |
| DNS anomalies | high NXDomain frequency / long labels | Zeek DNS logs + Elastic correlation |
11. Monitoring the monitoring system
An NSM sensor can become unreliable if its capture path drops packets or its storage pipeline is saturated. I therefore treated sensor health as part of the project.
Important checks included:
- Cisco interface rates, drops and SPAN session state;
- Suricata packet loss, RX drops, CPU/thread usage and
eve.jsonlatency; - Elasticsearch event rate, write queues, disk usage and ILM state;
- Zeek log volumes and parsing errors;
- TLS visibility through JA3/JA4-style metadata when payload inspection is unavailable.
12. Problems encountered and mitigations
The report documents several real operational difficulties:
SPAN oversubscription
When too many sources are mirrored at once, the destination port can become the bottleneck. The mitigation was to narrow the mirrored sources and consider additional sessions/sensors where necessary.
Excessive false positives
Suricata initially generated too much noise. The mitigation was signature tuning, thresholds/suppressions and correlation with Zeek context.
Elasticsearch growth
The report notes indexes growing quickly and reaching roughly 30–40 GB. The mitigation was ILM with hot/warm/cold retention, compression and off-site snapshots.
Encrypted TLS traffic
Payload visibility is limited for HTTPS. Zeek metadata and TLS fingerprints such as JA3/JA4 were used to retain behavioral context without pretending encrypted content was directly visible.
Availability constraints
All testing had to respect the operational environment. Passive capture and controlled test timing were used specifically to reduce the chance of impacting production.
13. What this project demonstrates
This project demonstrates more than familiarity with individual tools. It connects networking, detection engineering and SOC operations:
- Cisco VLAN/trunk/PVLAN design;
- SPAN/RSPAN acquisition;
- management-plane hardening and verification;
- SELKS deployment;
- Suricata signature-based IDS;
- Zeek behavioral telemetry;
- Elastic/Kibana investigation;
- Scirius rule governance;
- baselining and controlled validation;
- performance, packet-loss and storage monitoring;
- tuning based on operational constraints.
14. What I would extend next
The report identifies several sensible next steps:
- a second SELKS sensor for broader east–west coverage;
- stronger integration with SOC ticketing and N1/N2/N3 escalation;
- a documented NSM runbook;
- selective SOAR integration for approved response actions;
- broader OT/SCADA coverage with protocol-specific monitoring;
- further behavioral/UEBA experimentation.